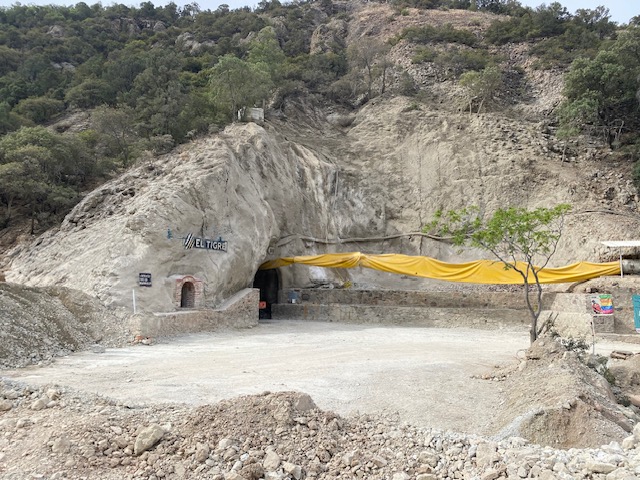
El Tigre Historic Mine District
Sonora, Mexico
Sonora, Mexico
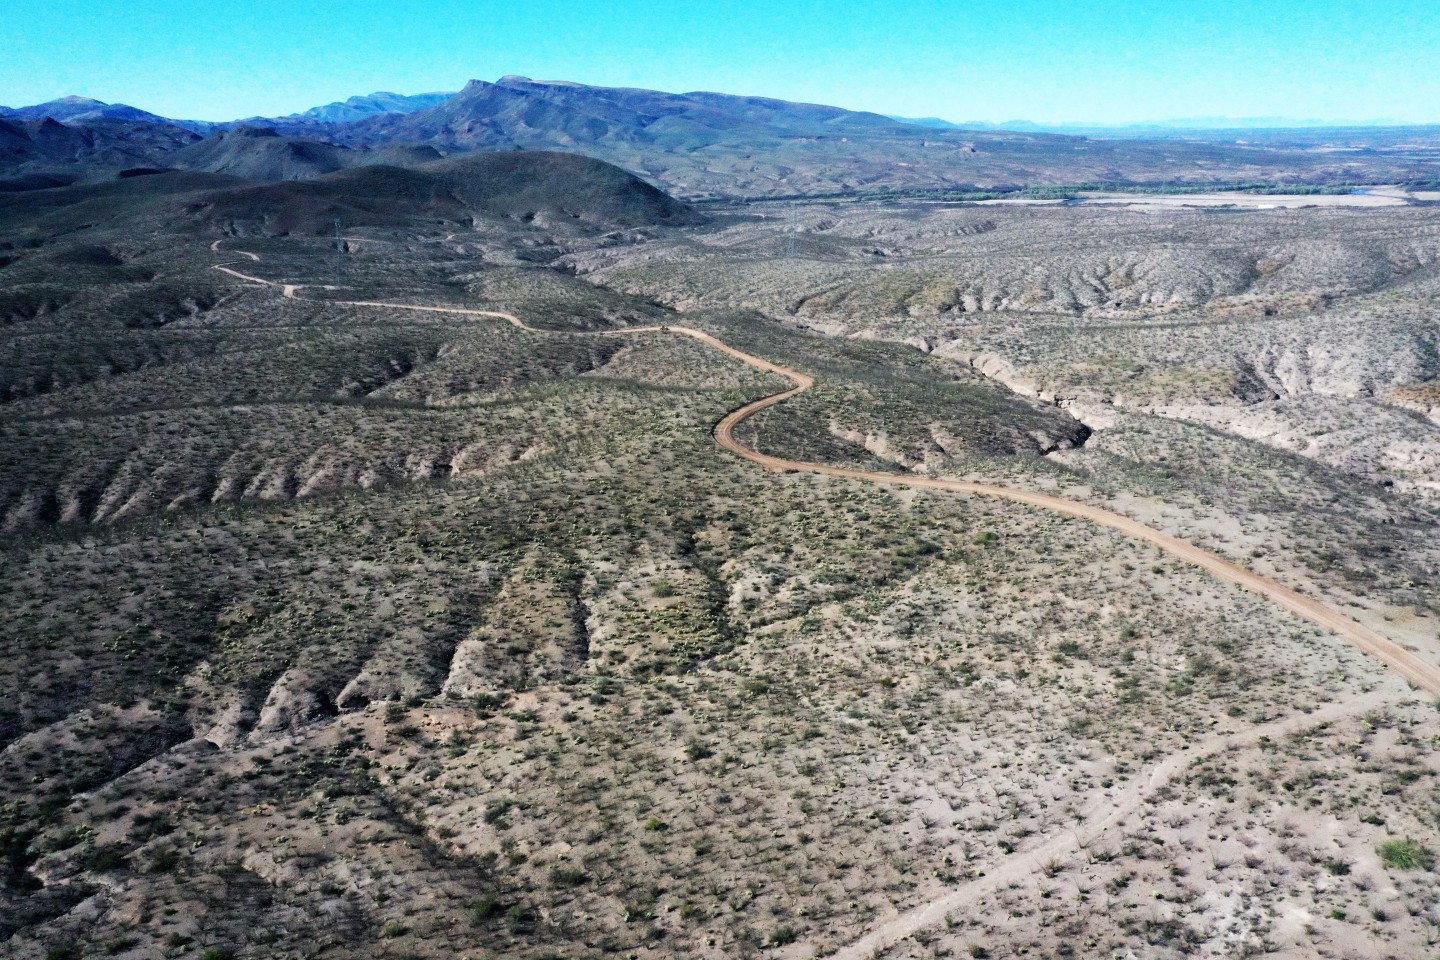
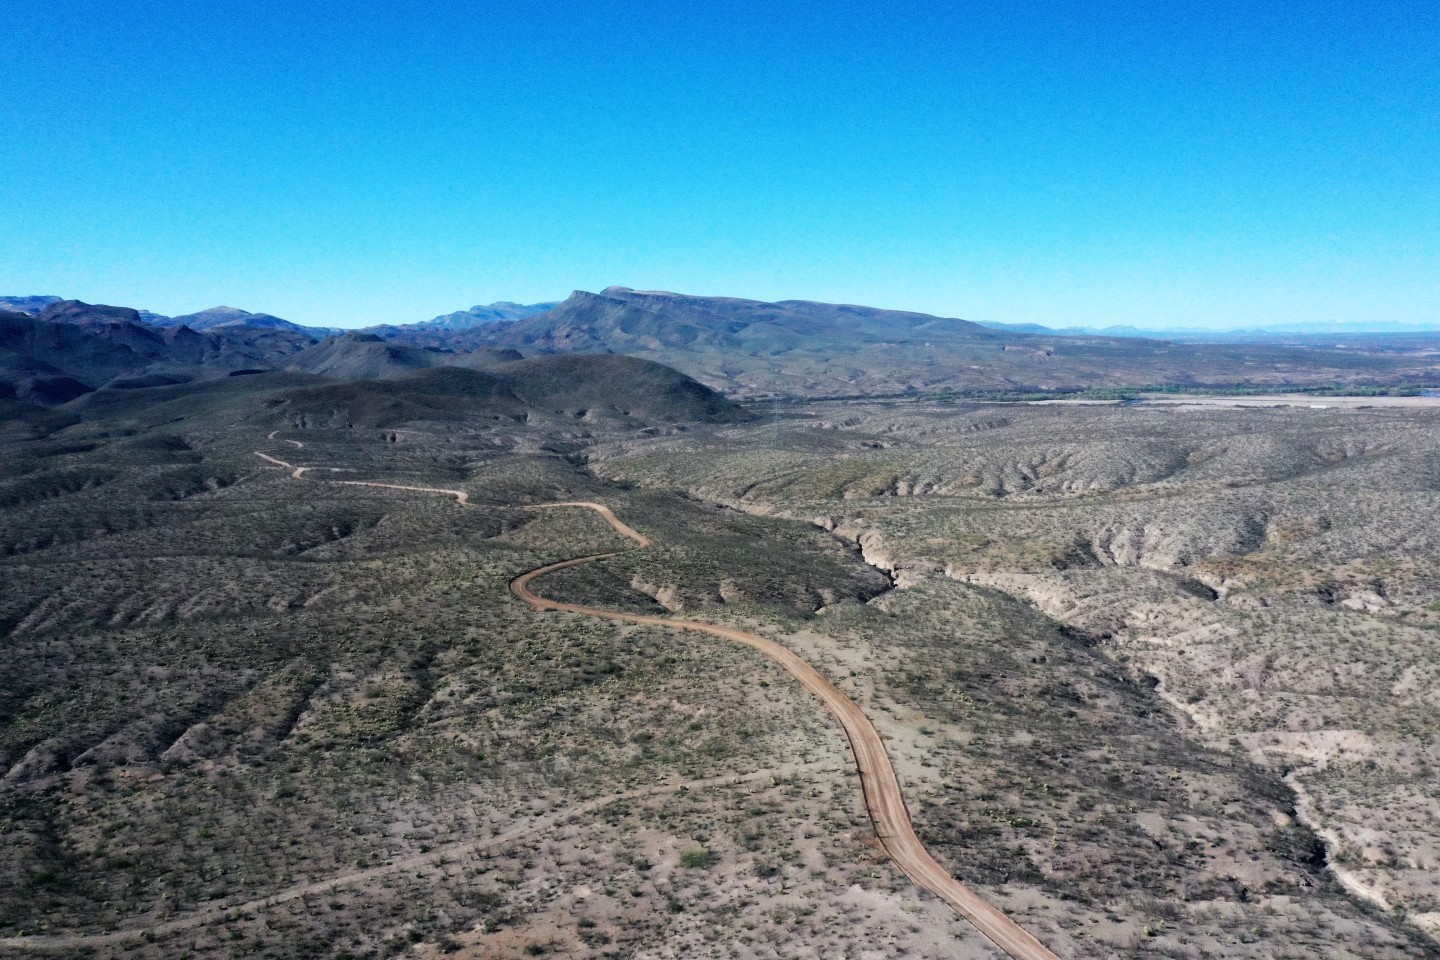
Silver Tiger Metals Inc. is a Canadian company whose management has more than 25 years’ experience discovering, financing and building large hydrothermal silver projects in Mexico. Silver Tiger’s 100% owned 28,414 hectare Historic El Tigre Mining District is located in Sonora, Mexico. Principled environmental, social and governance practices are core priorities at Silver Tiger.
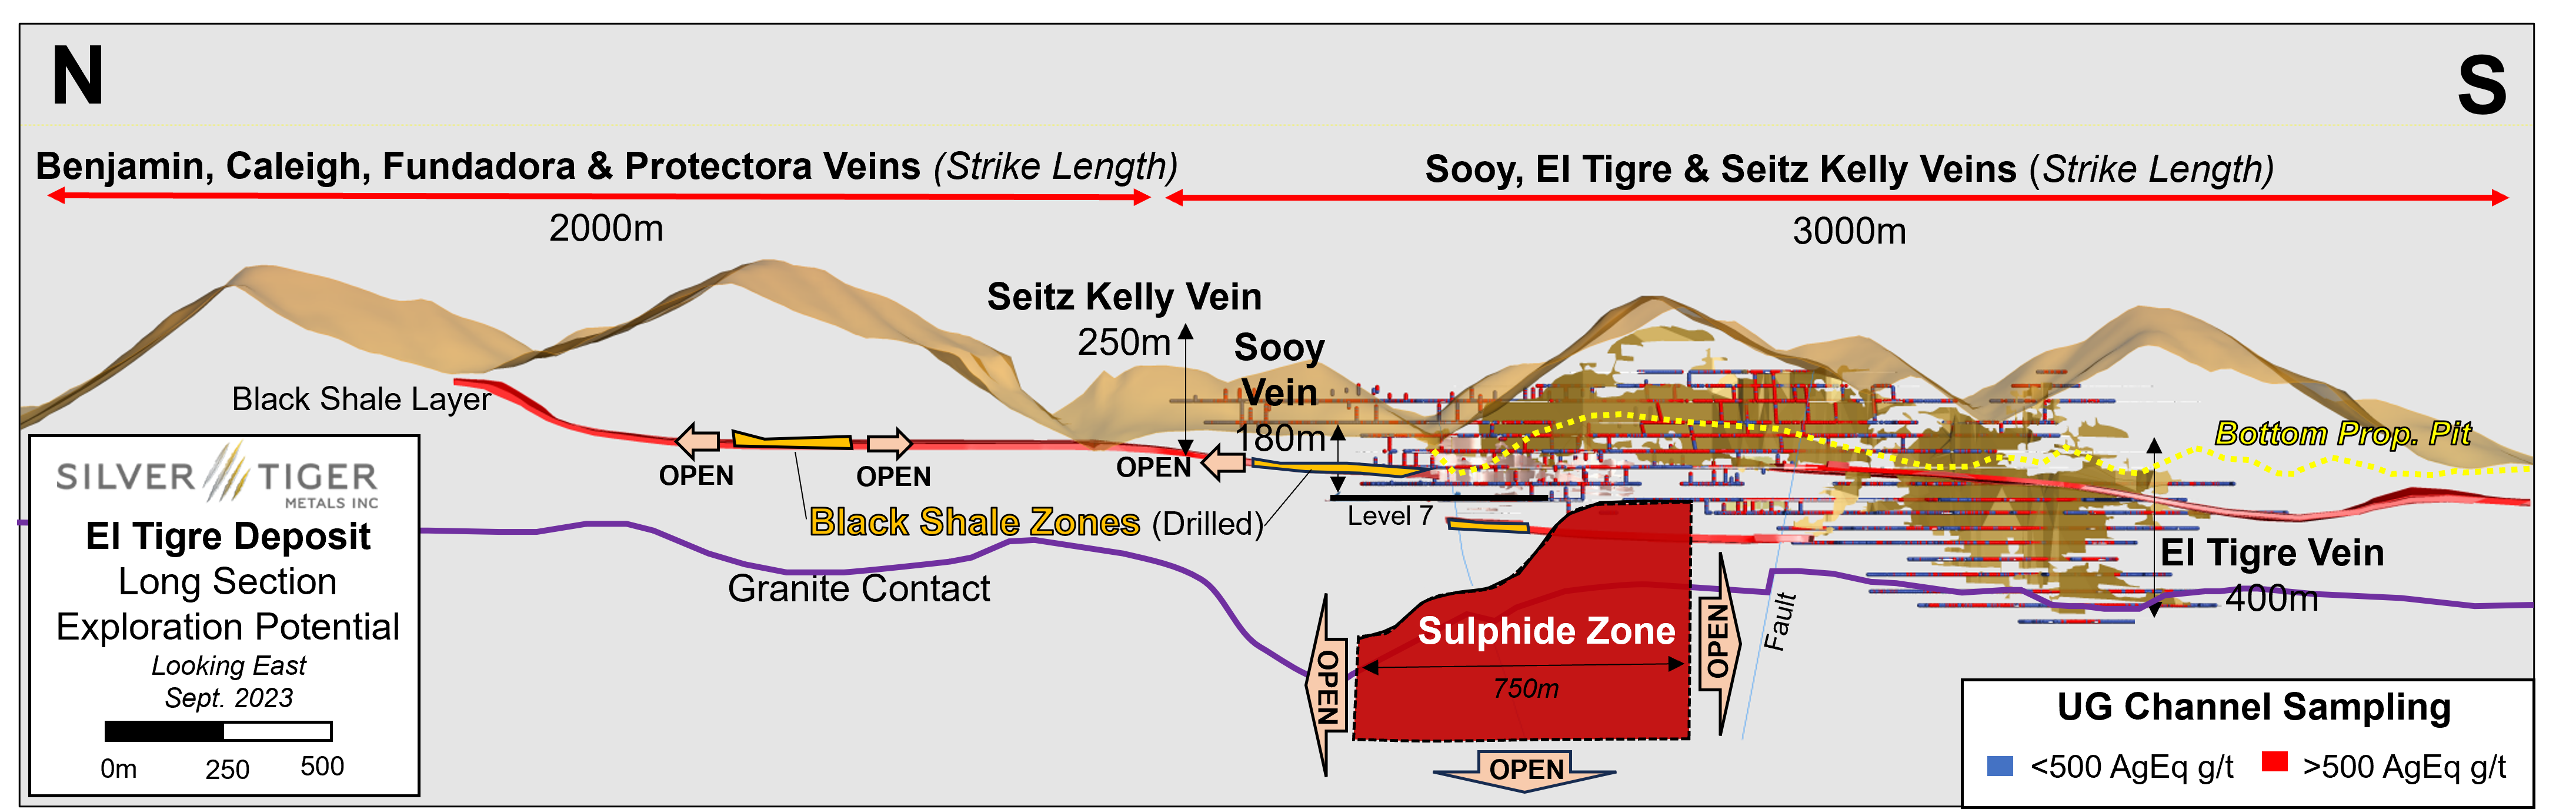
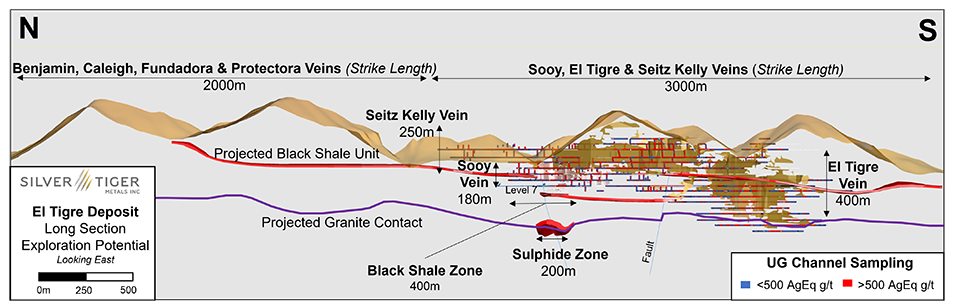
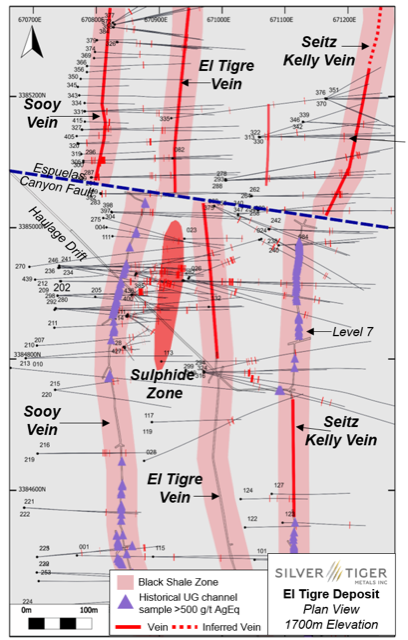
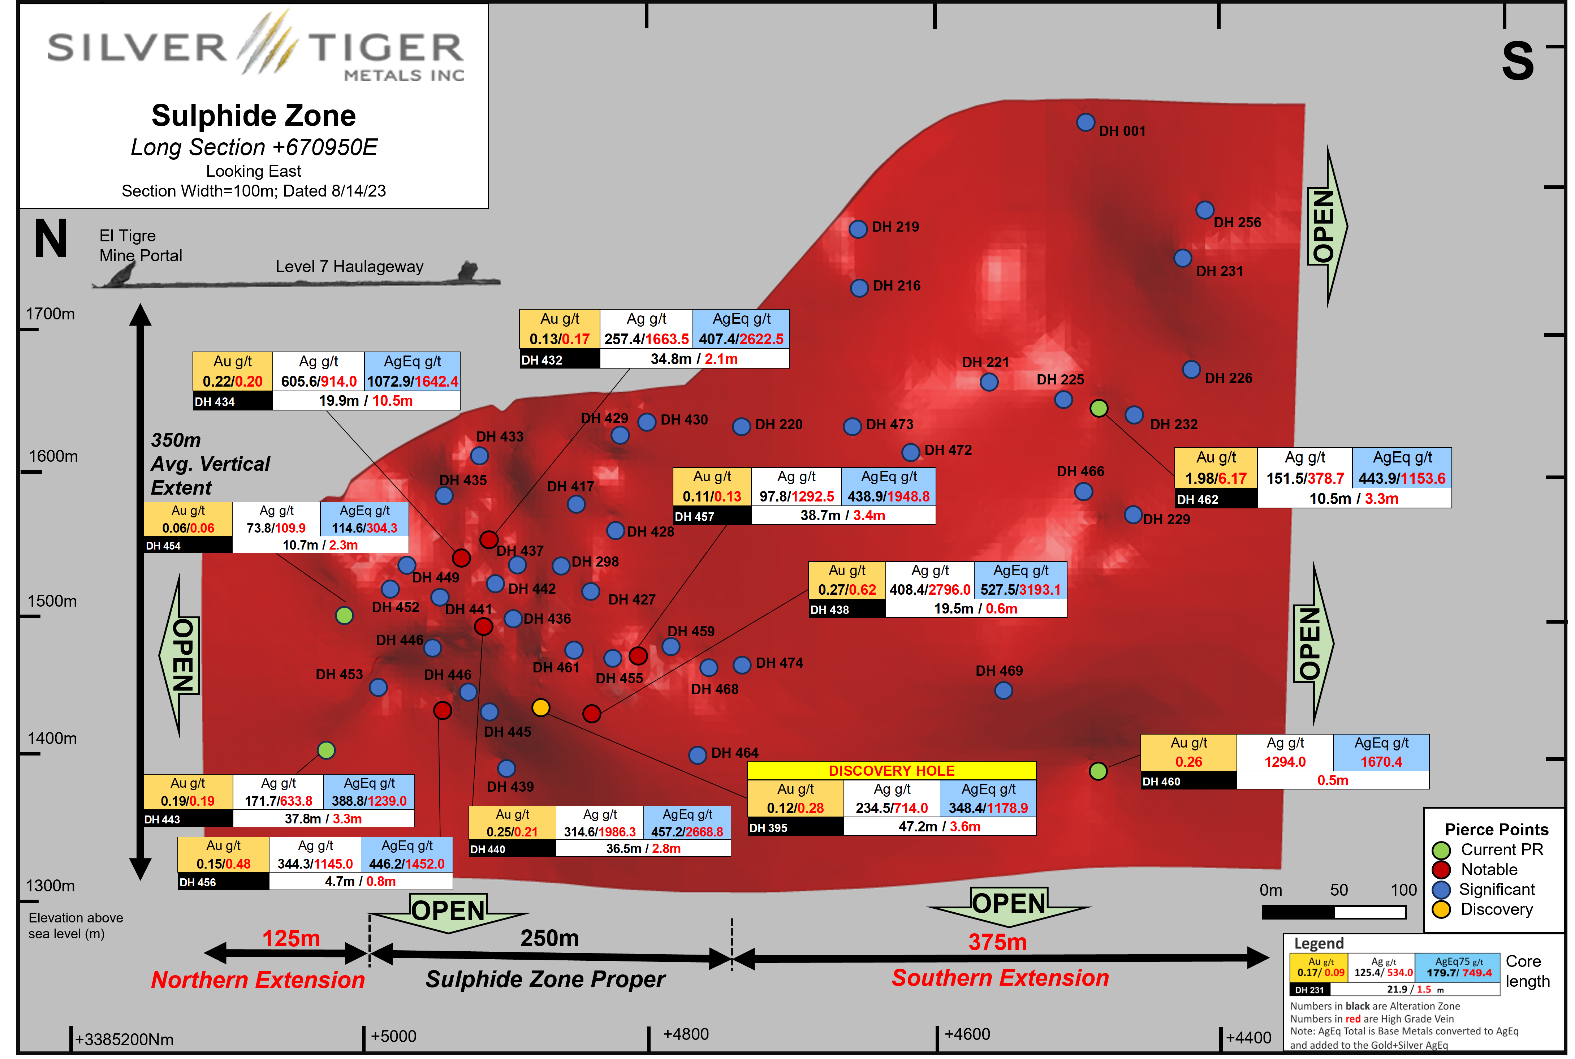
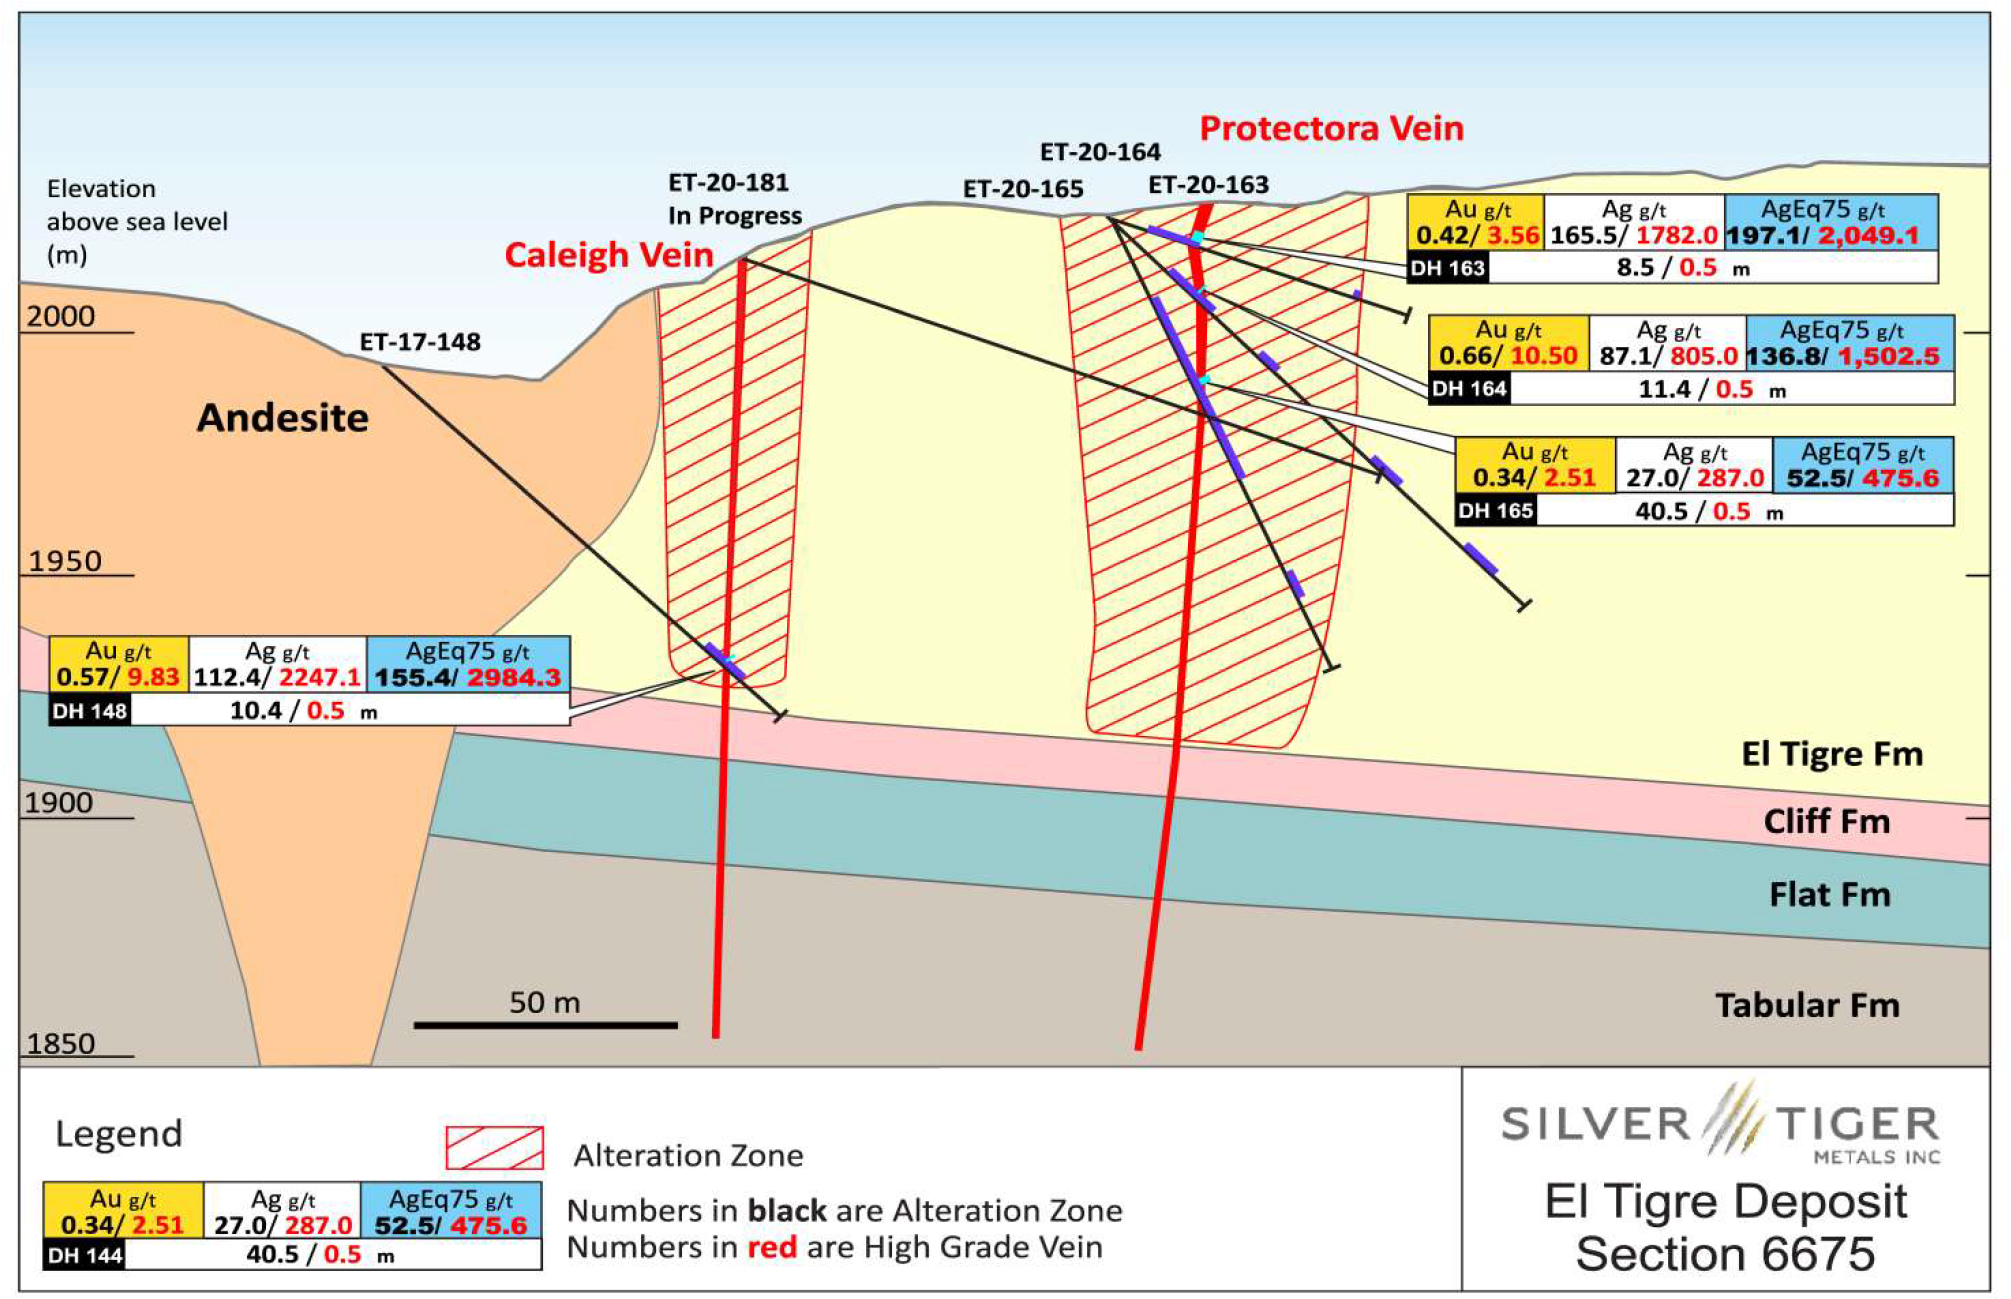
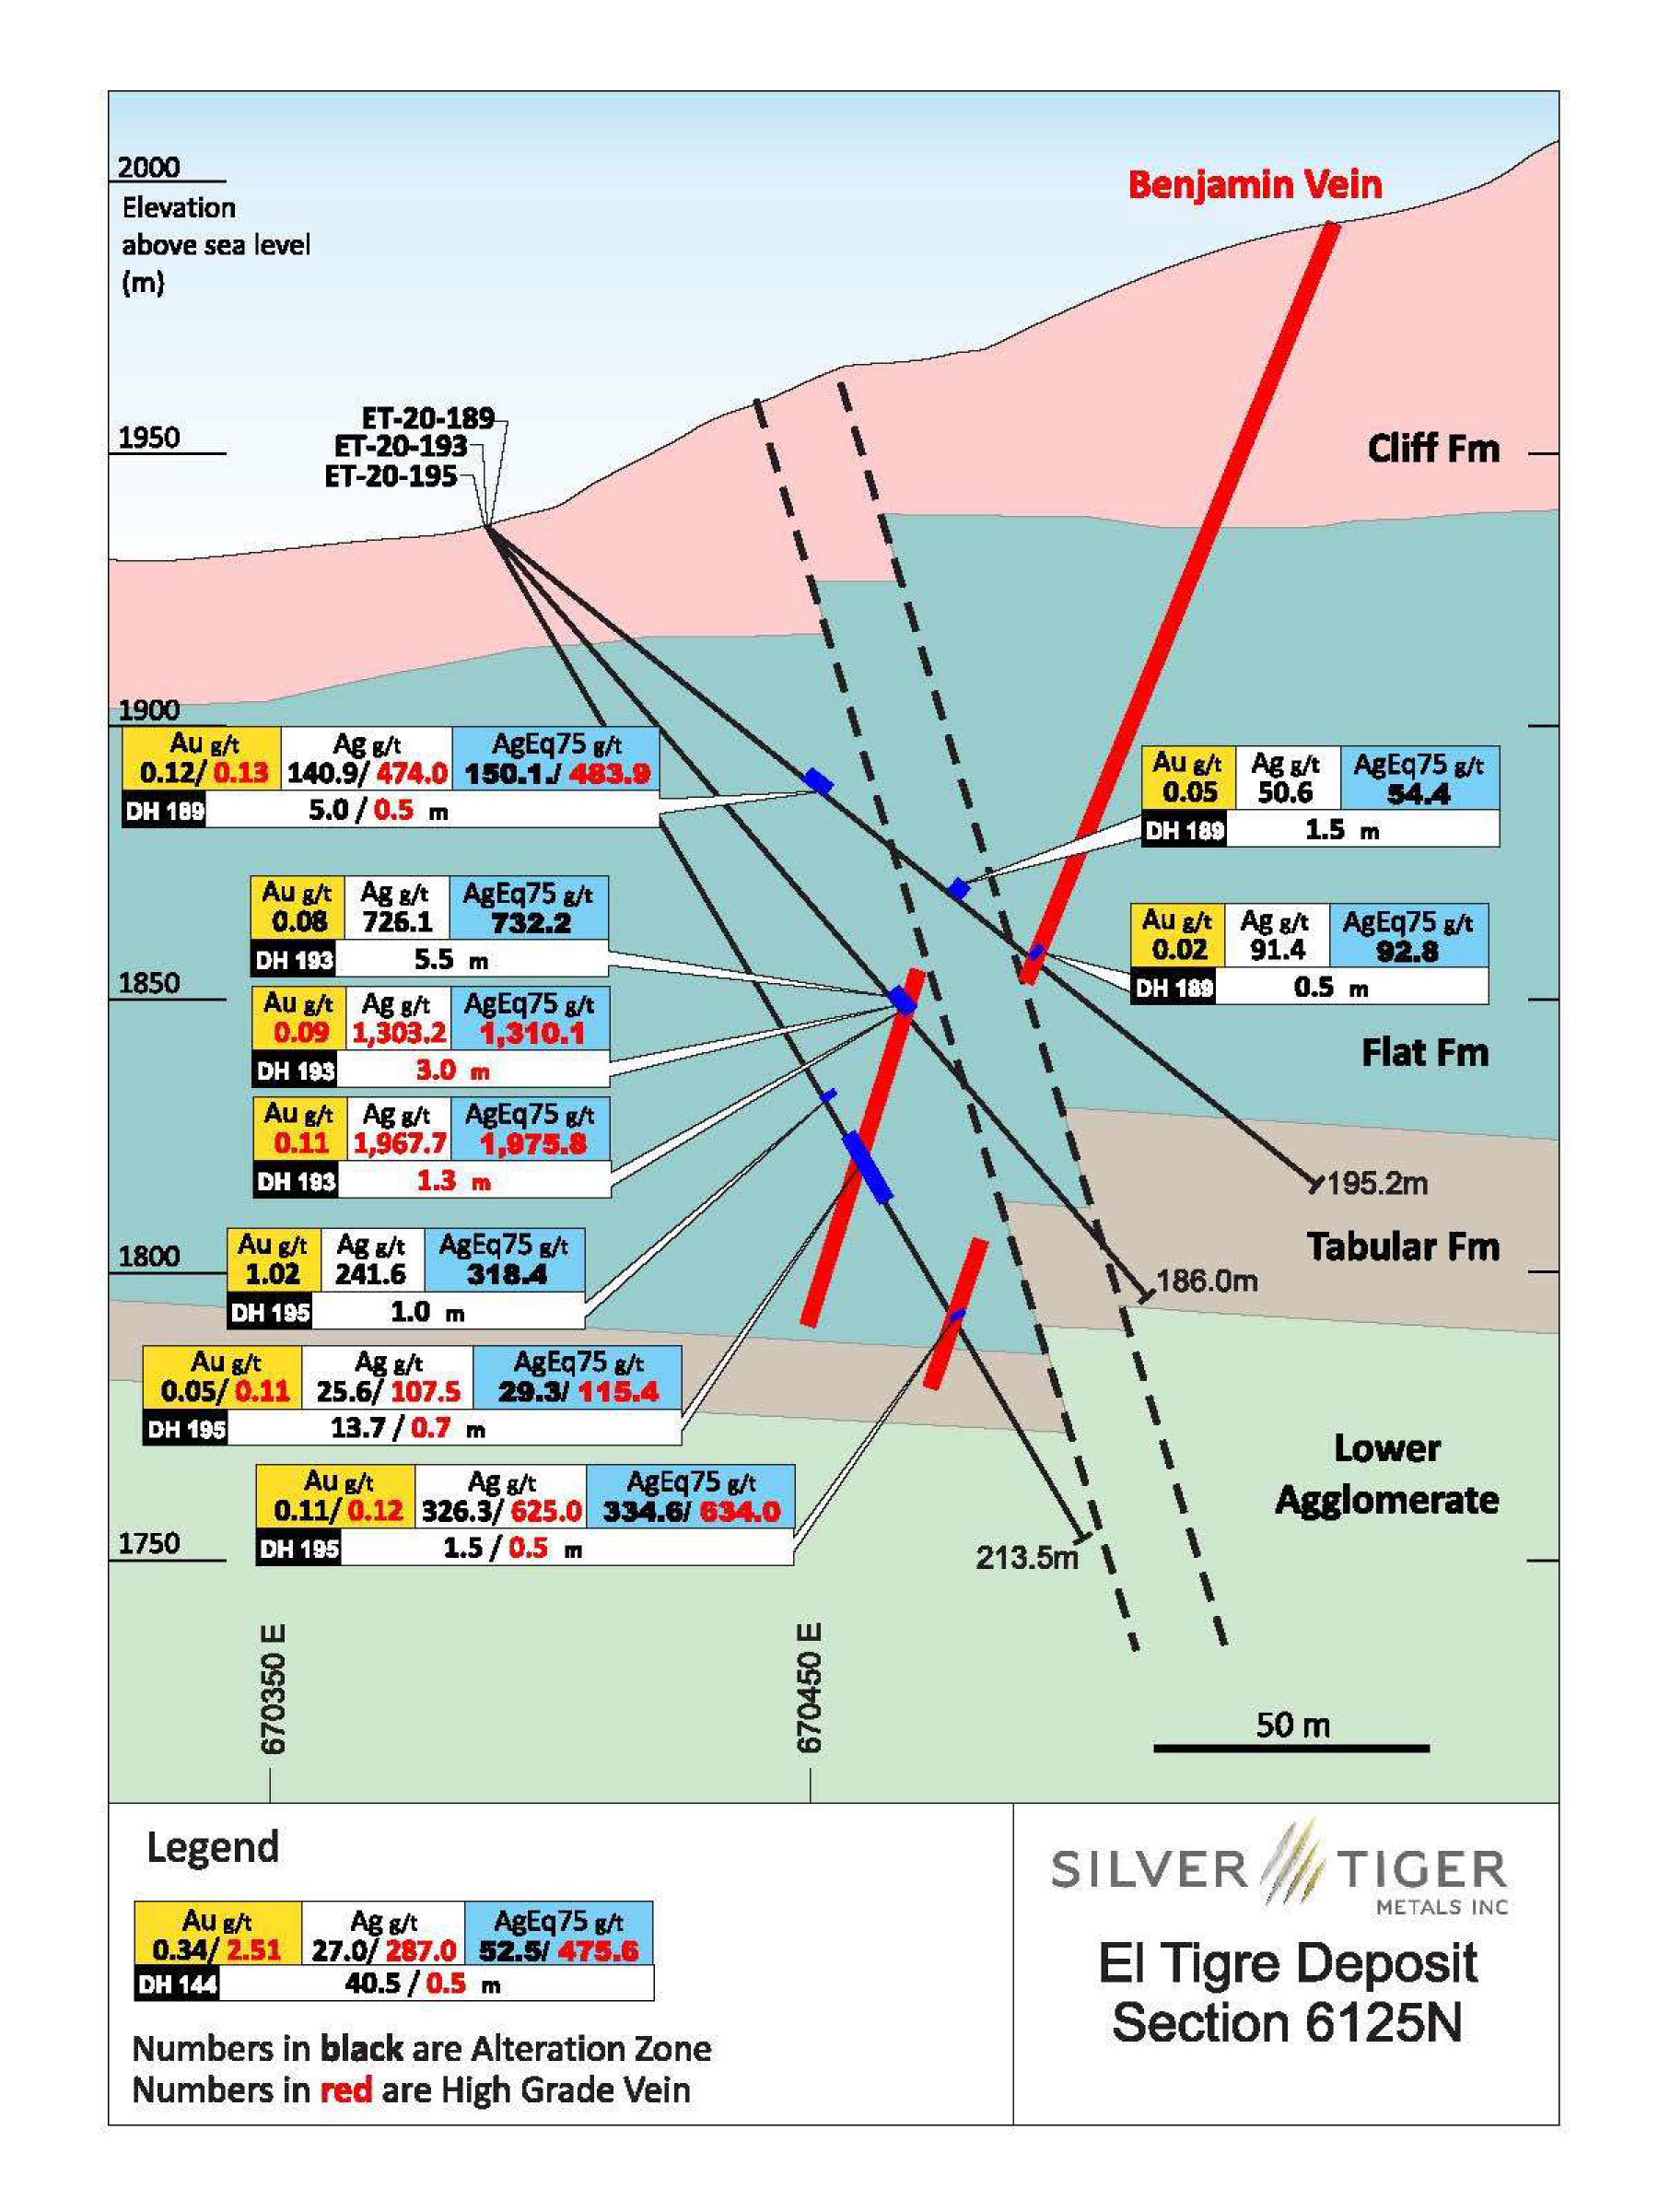
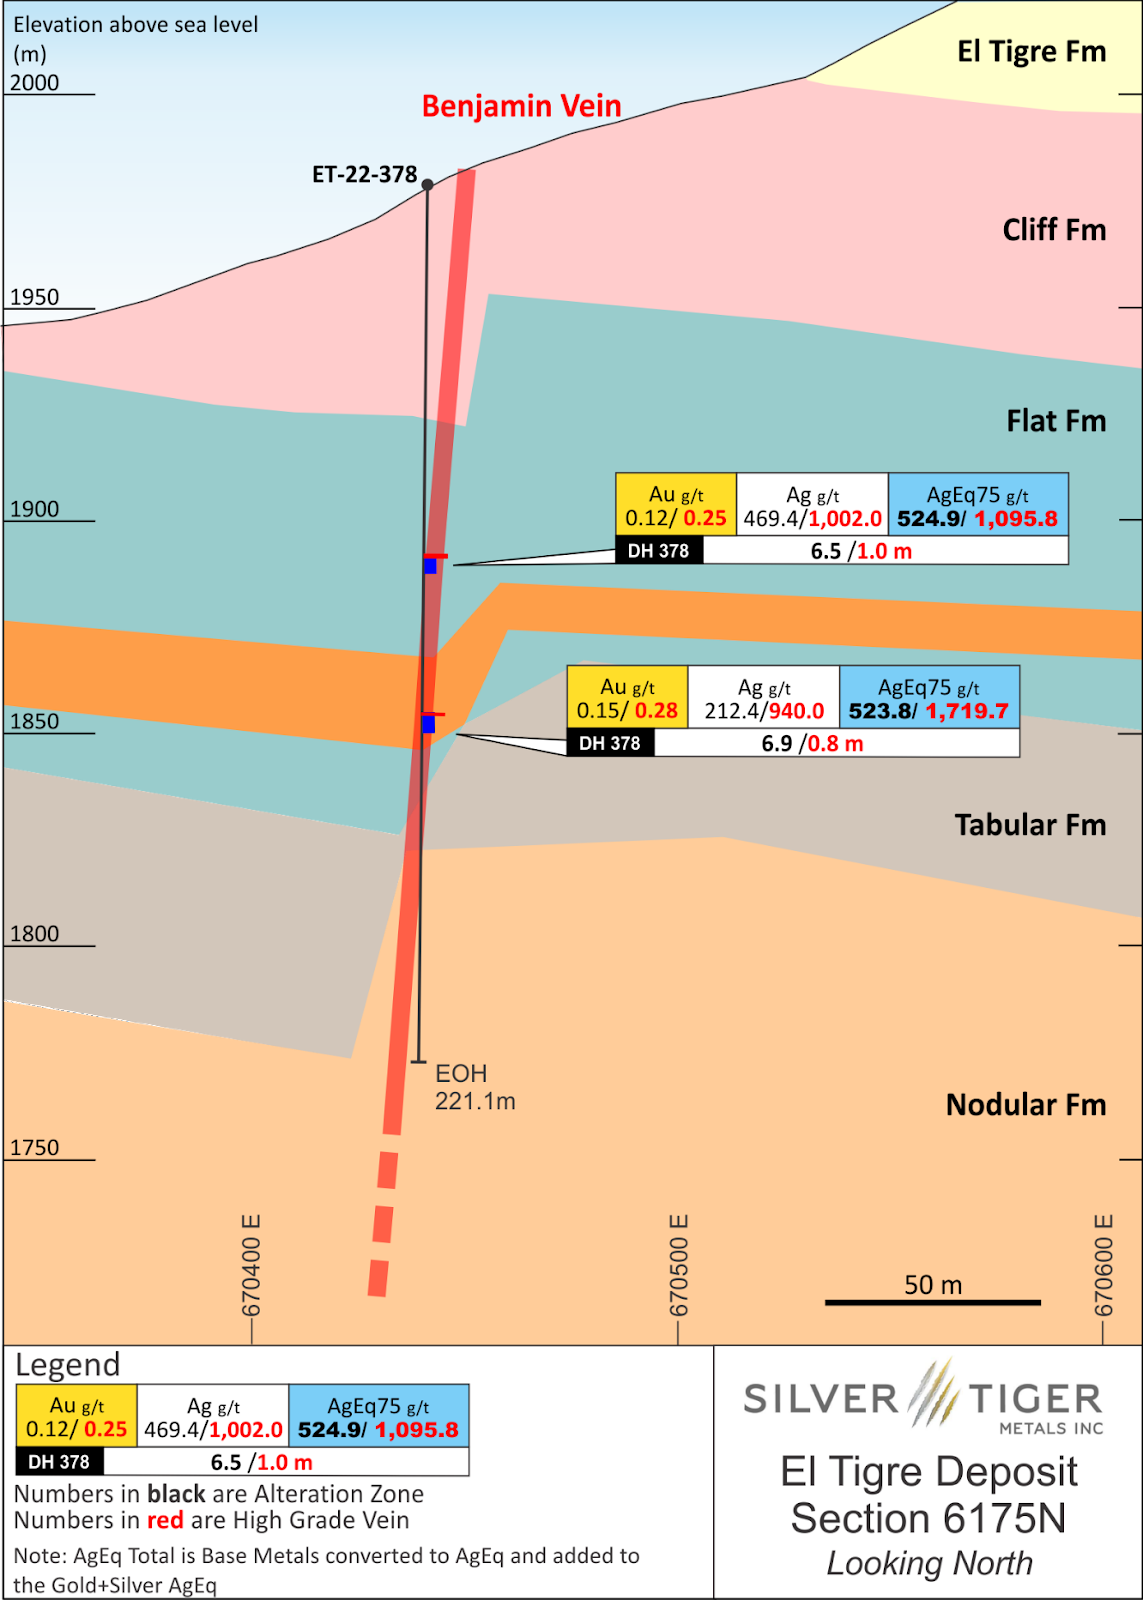
El Tigre Deposit – Long Section Exploration Potential – Looking East
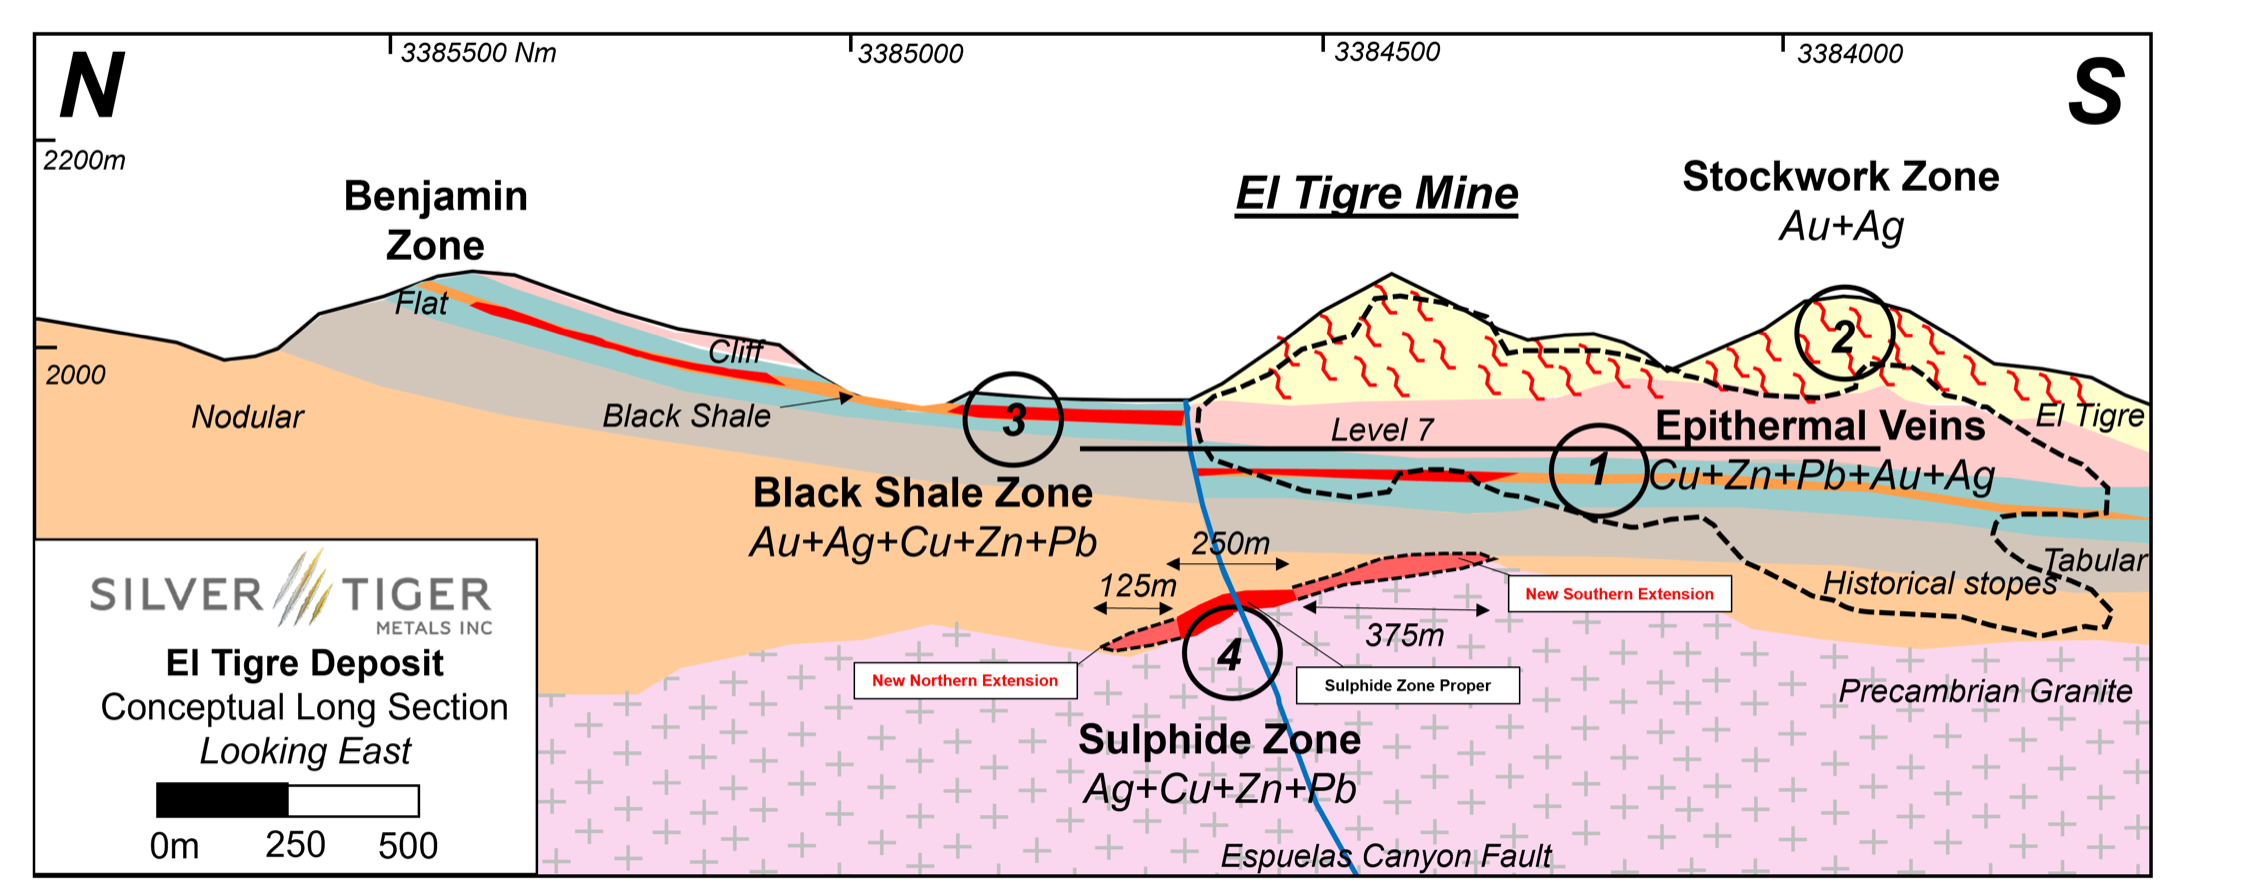
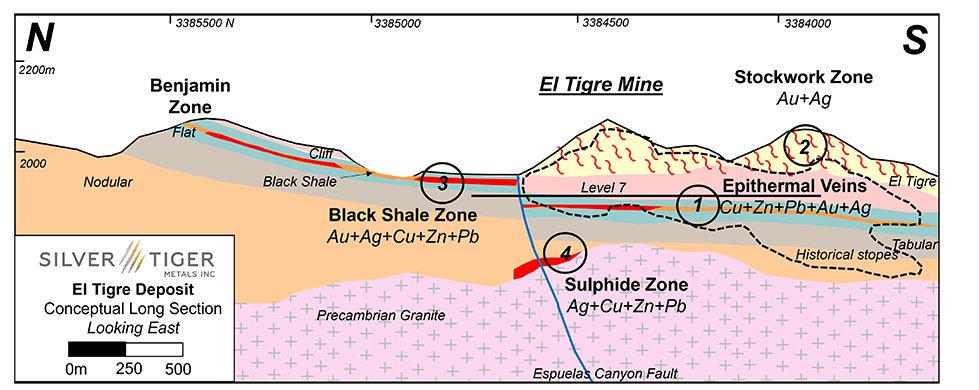
El Tigre Deposit – Conceptual Long Section – Looking East
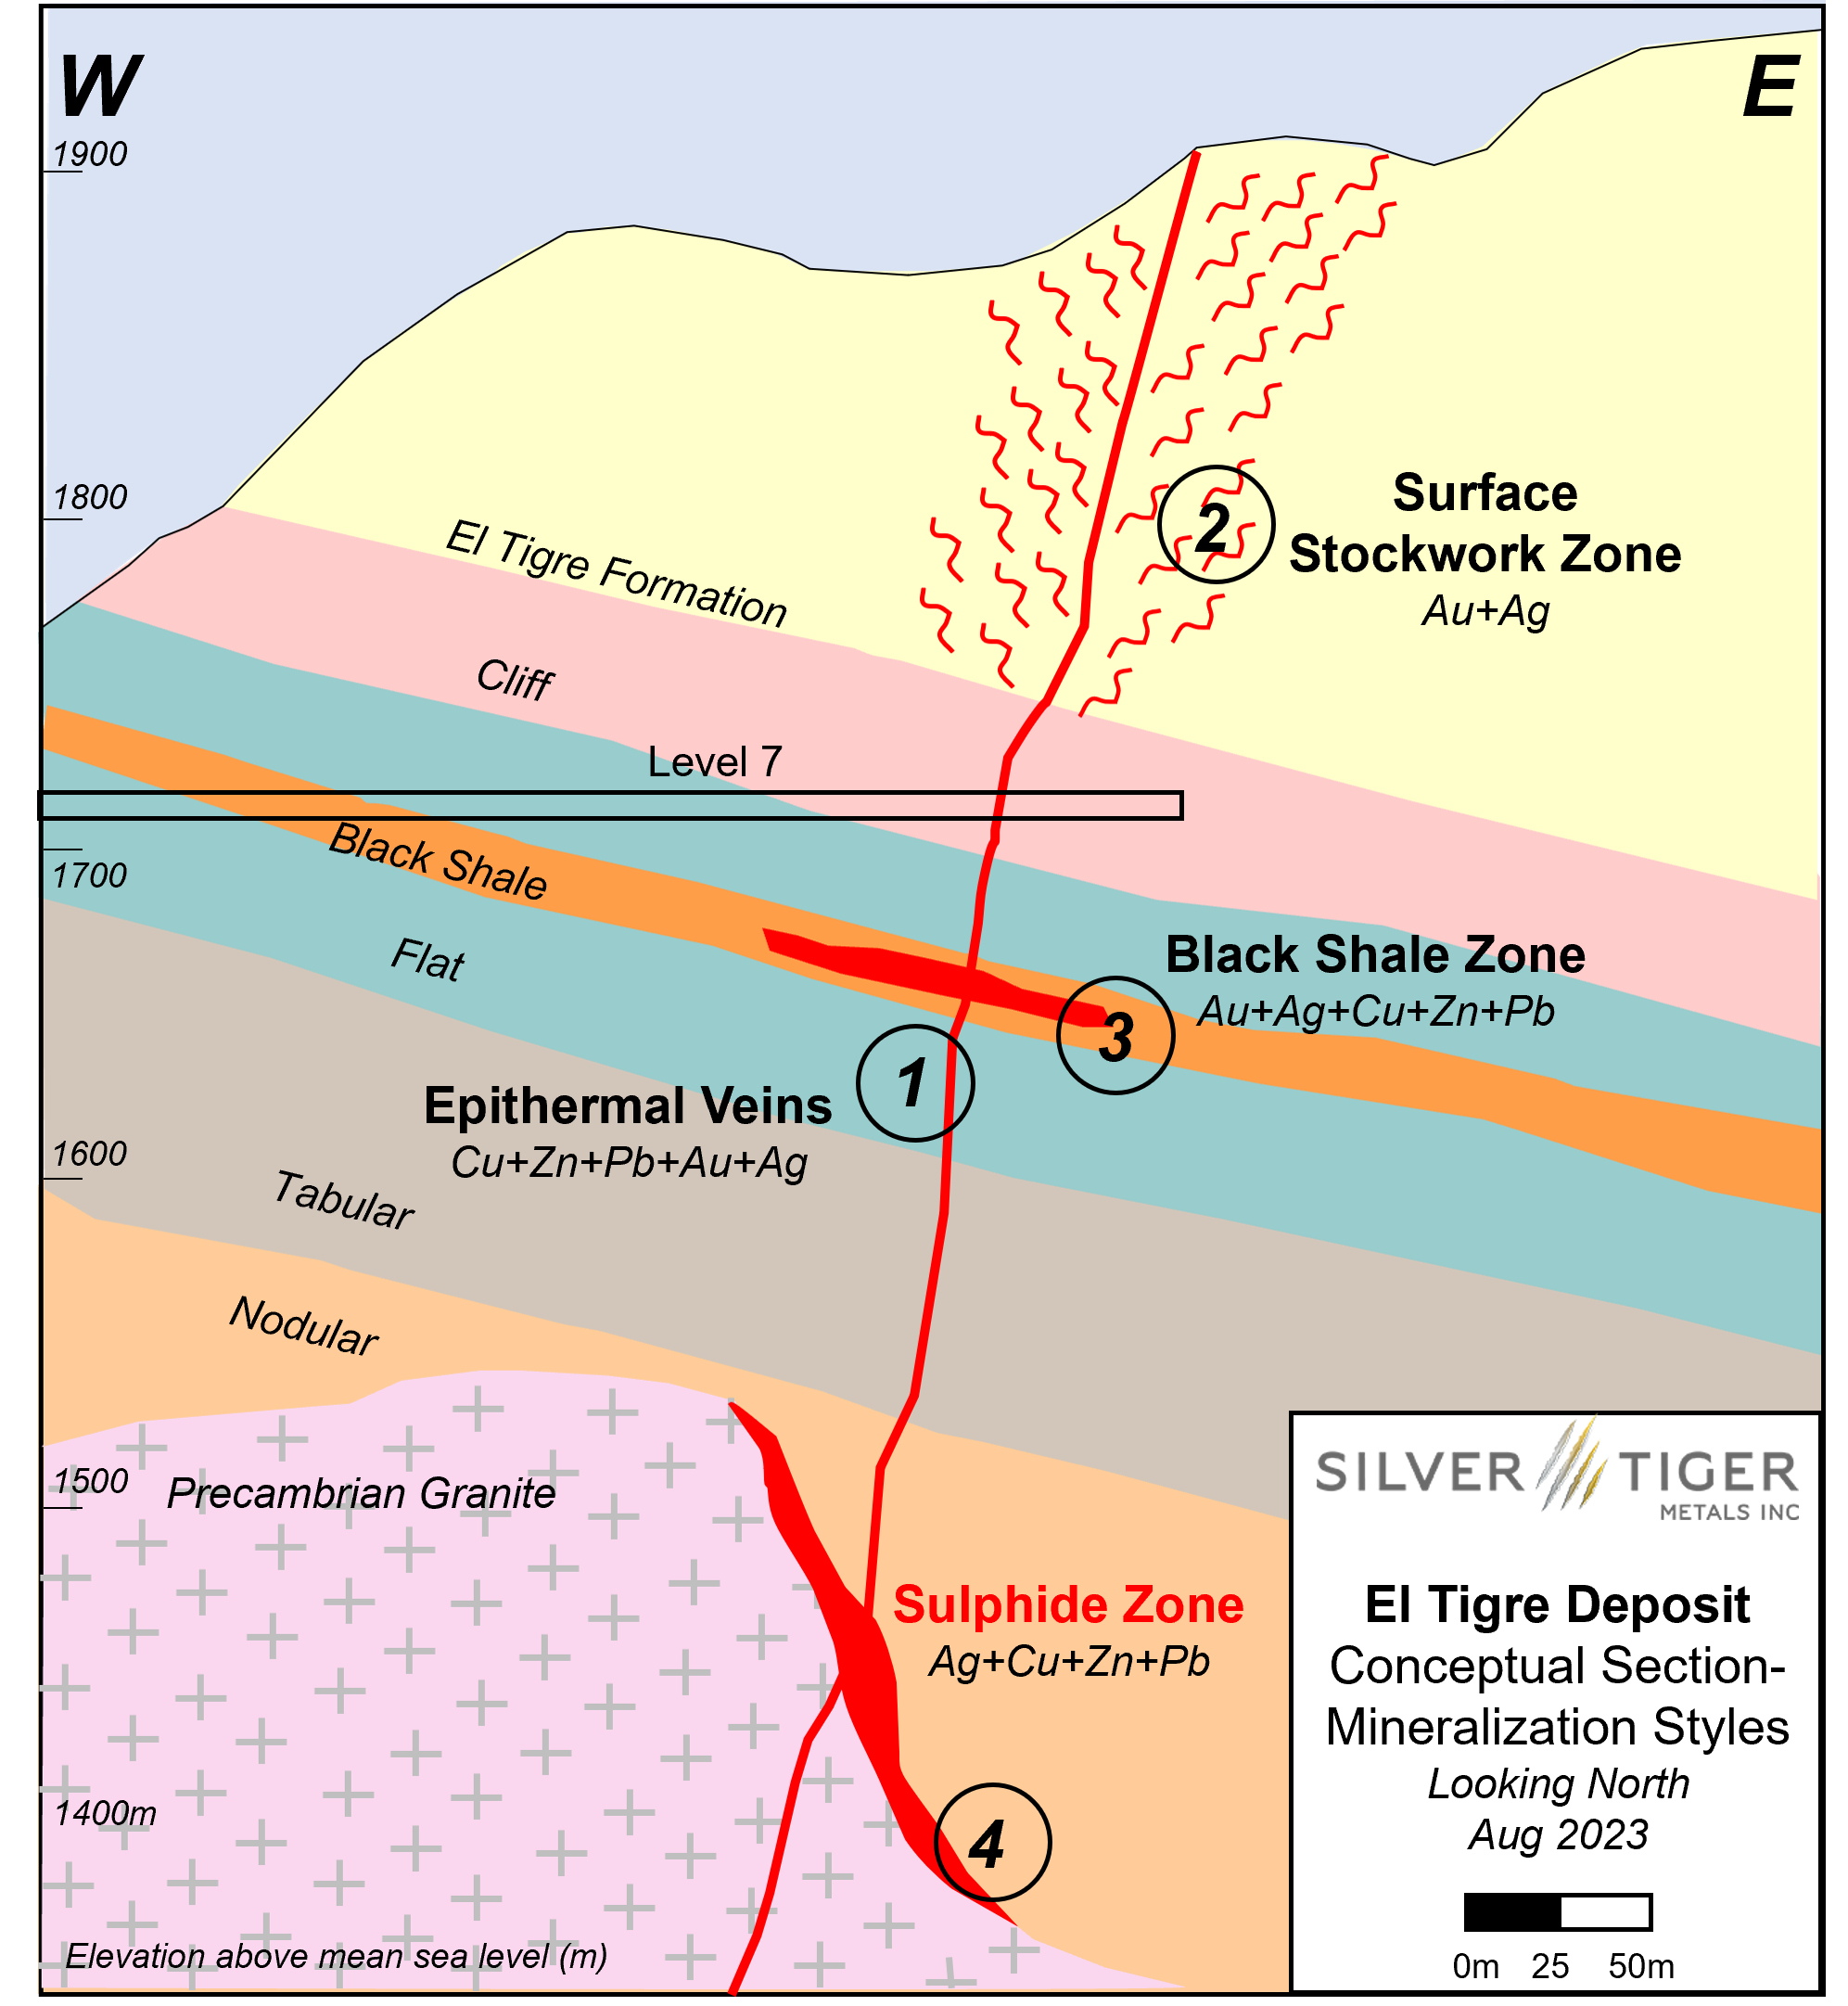
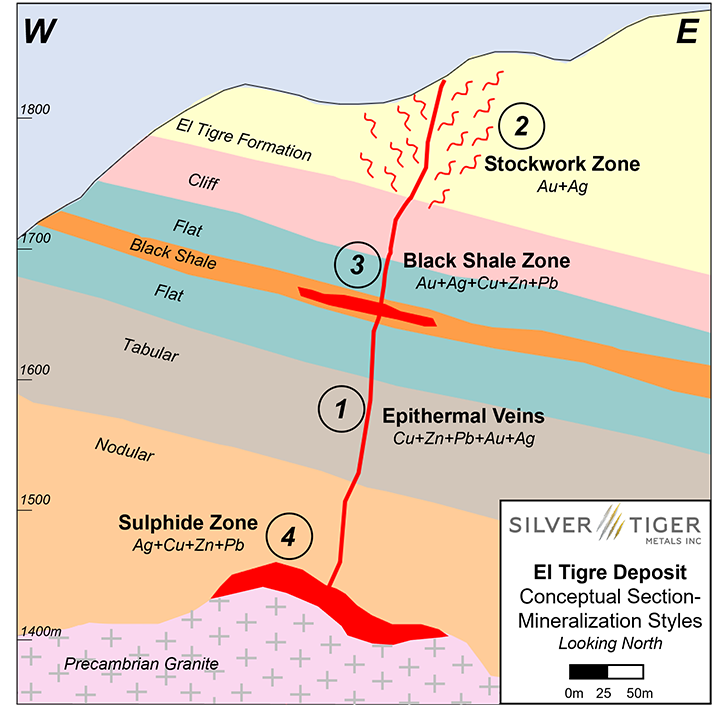
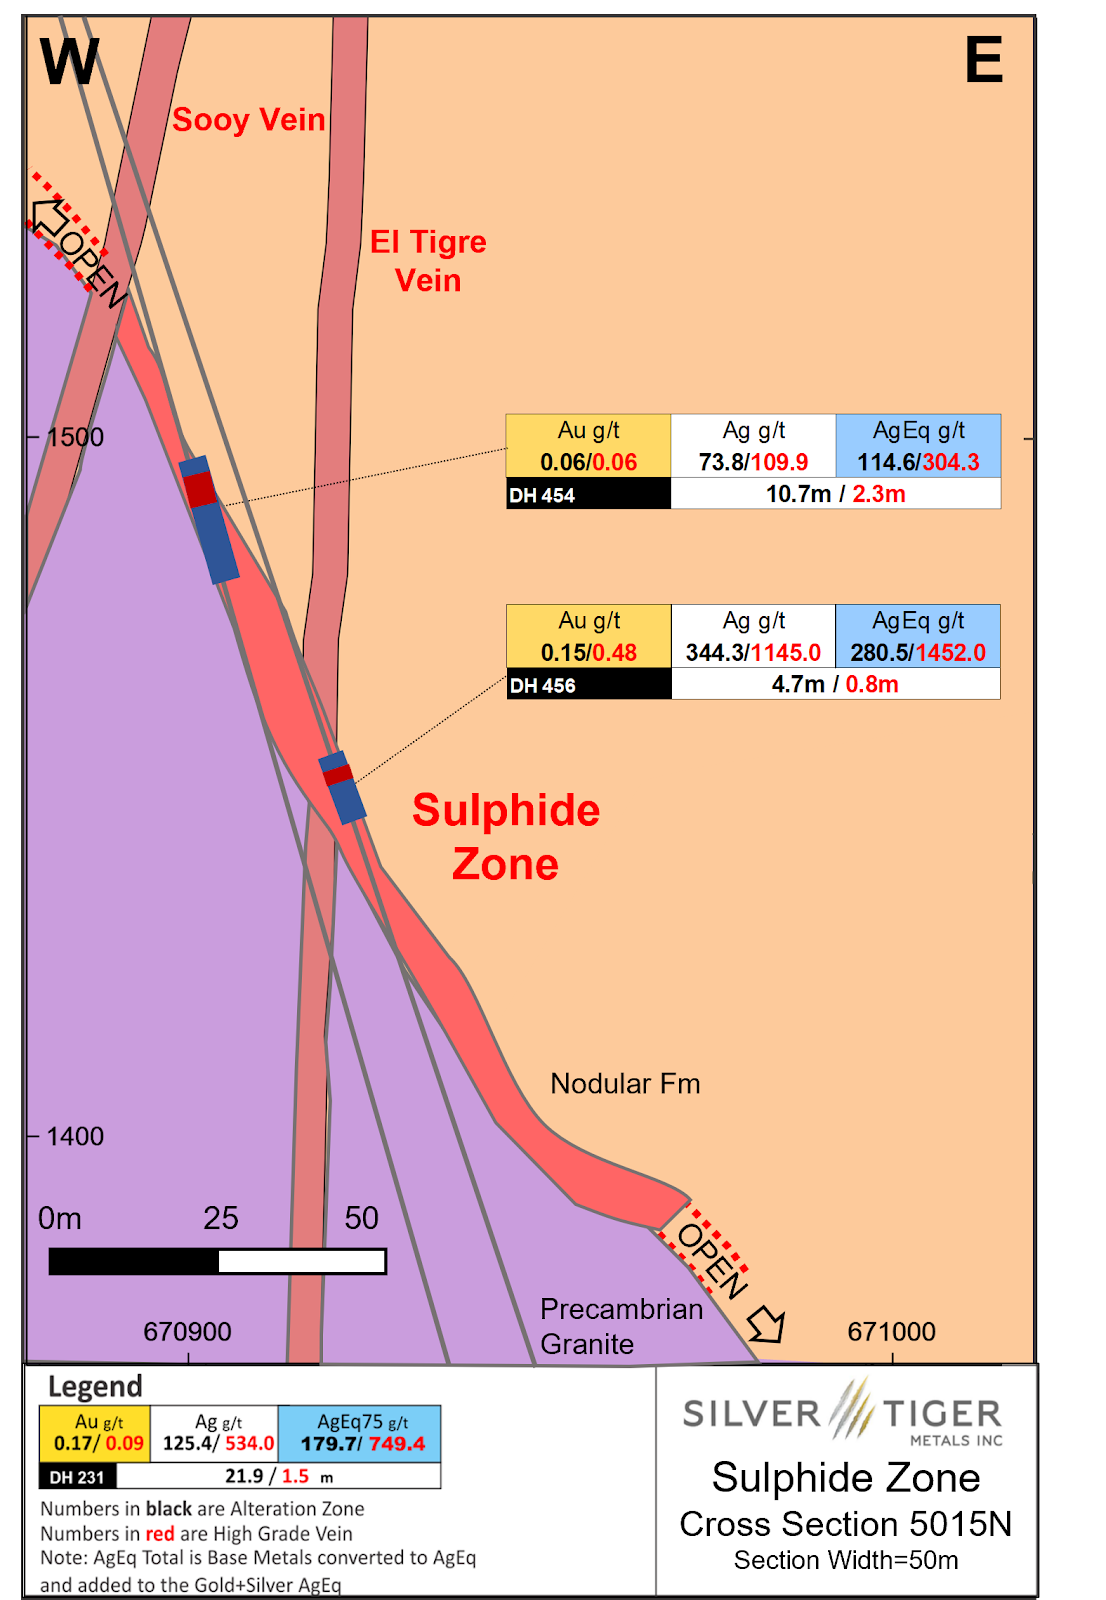
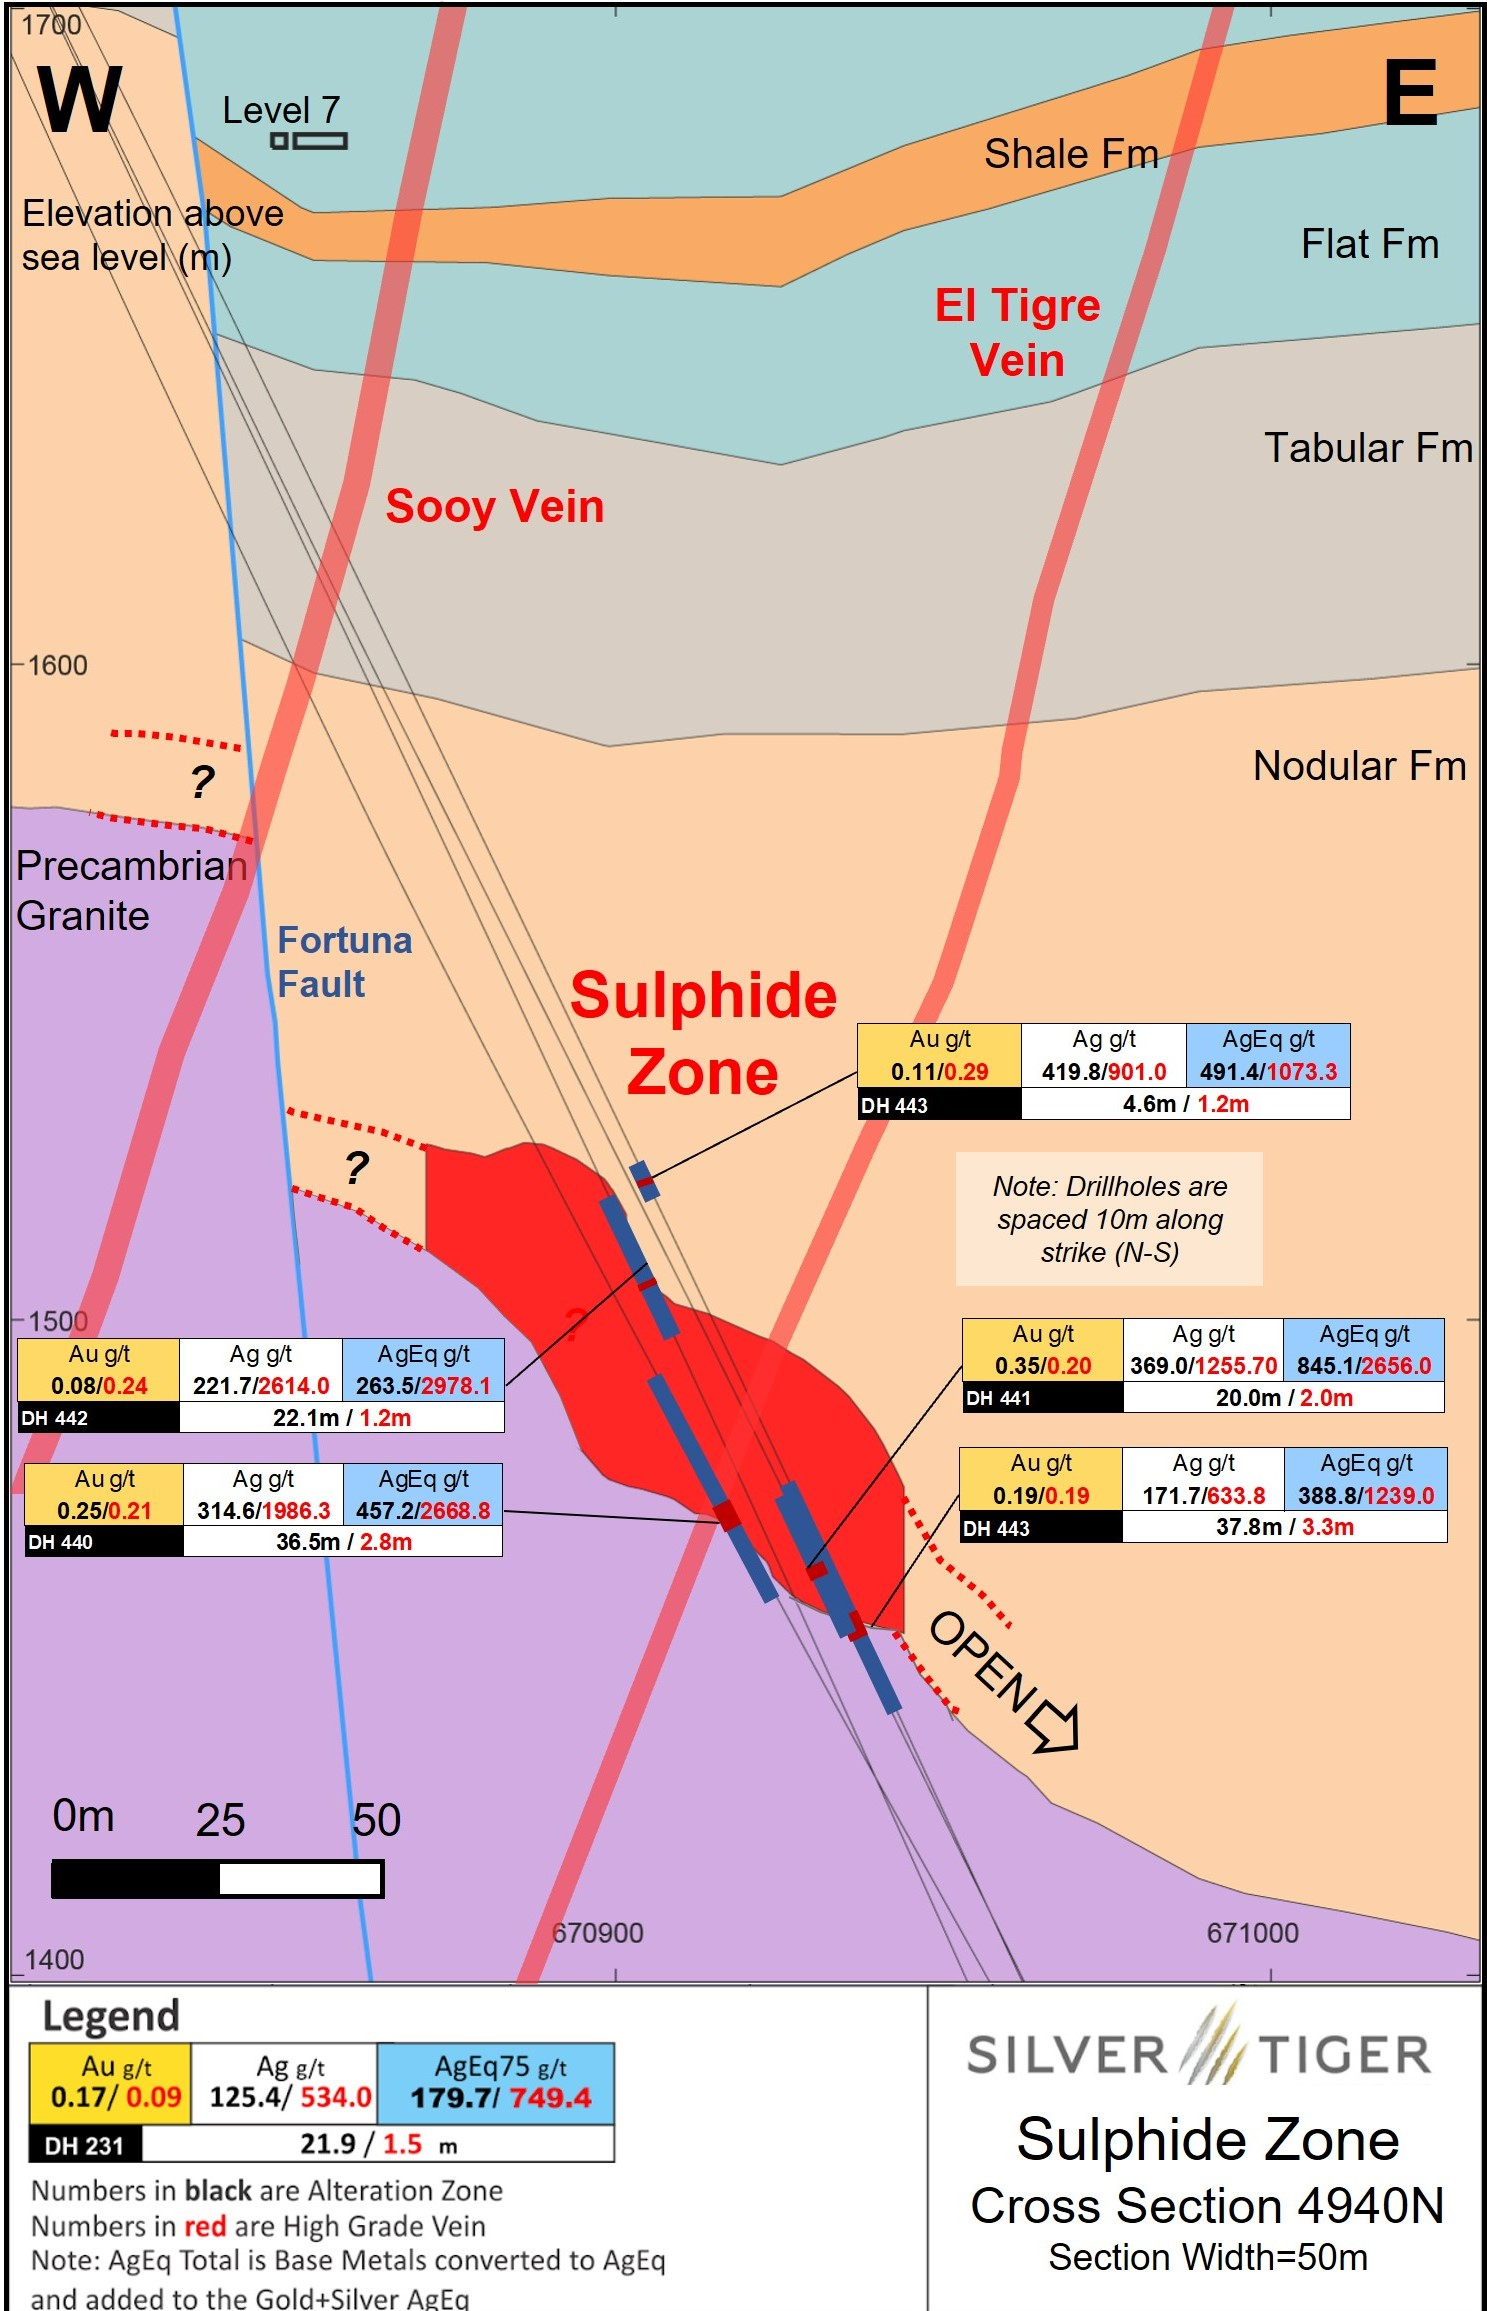
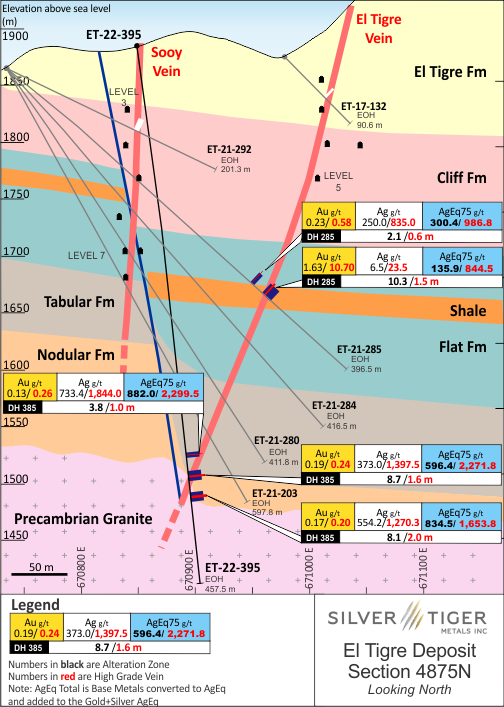
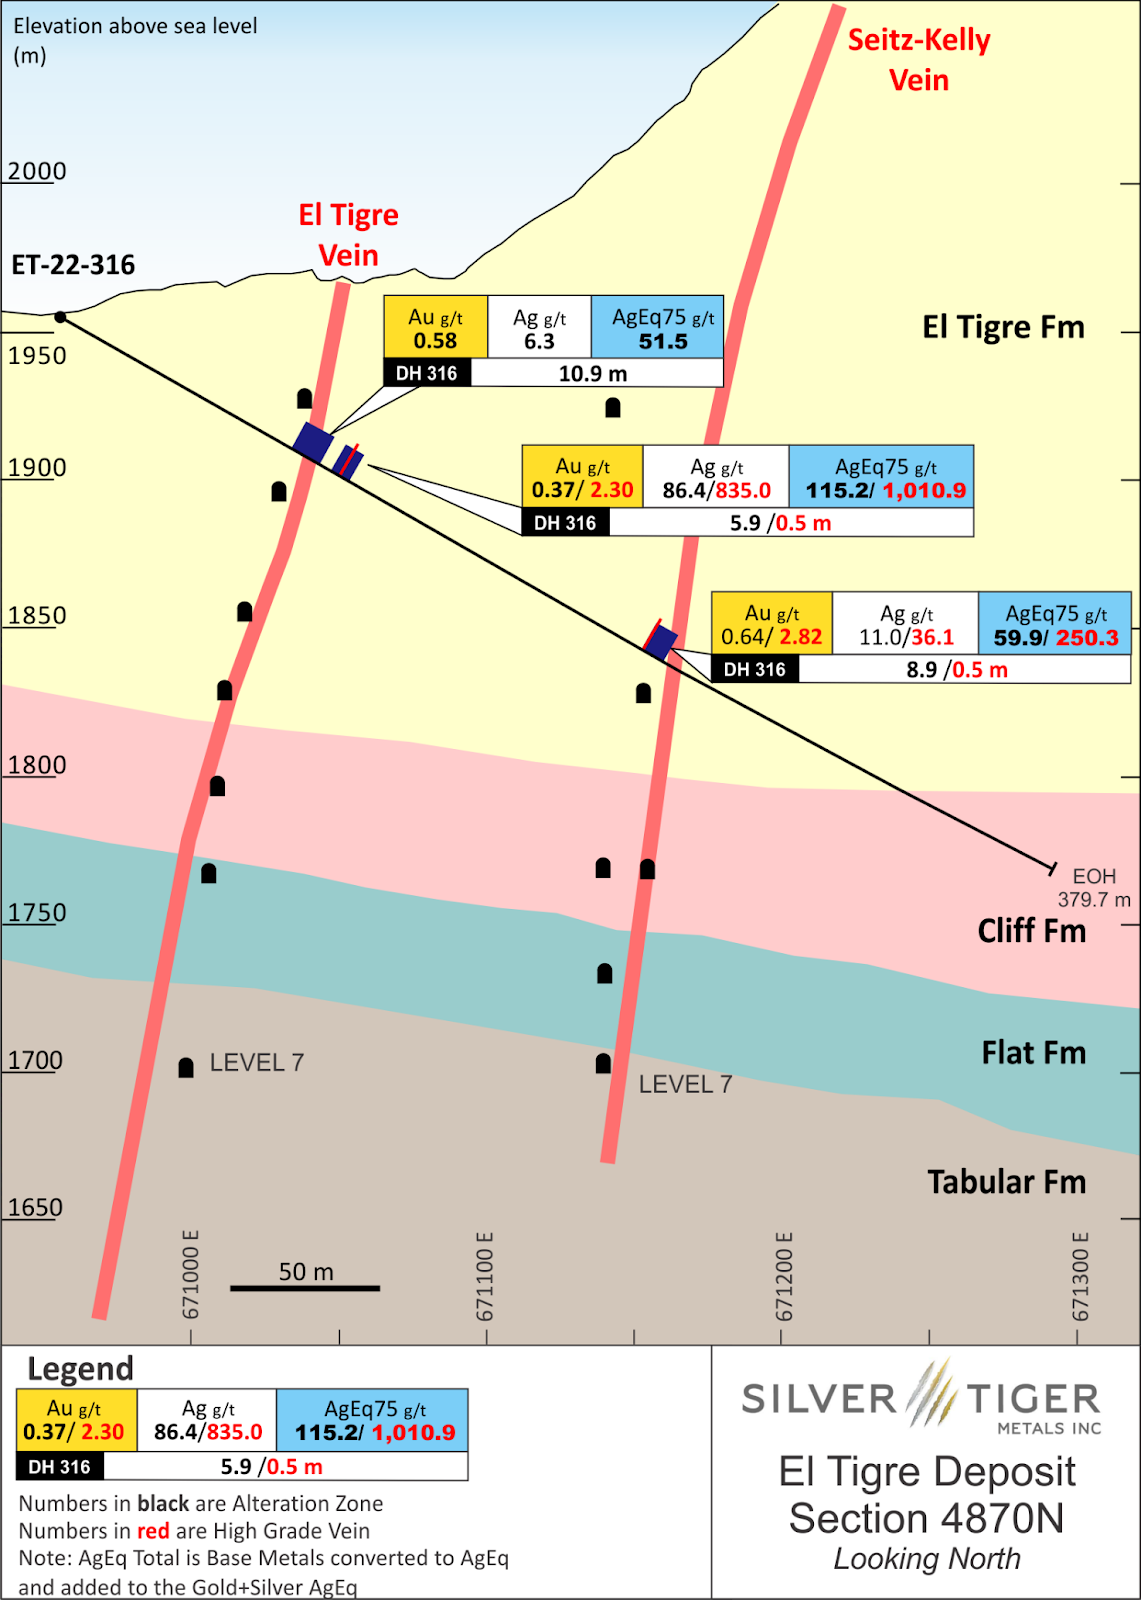
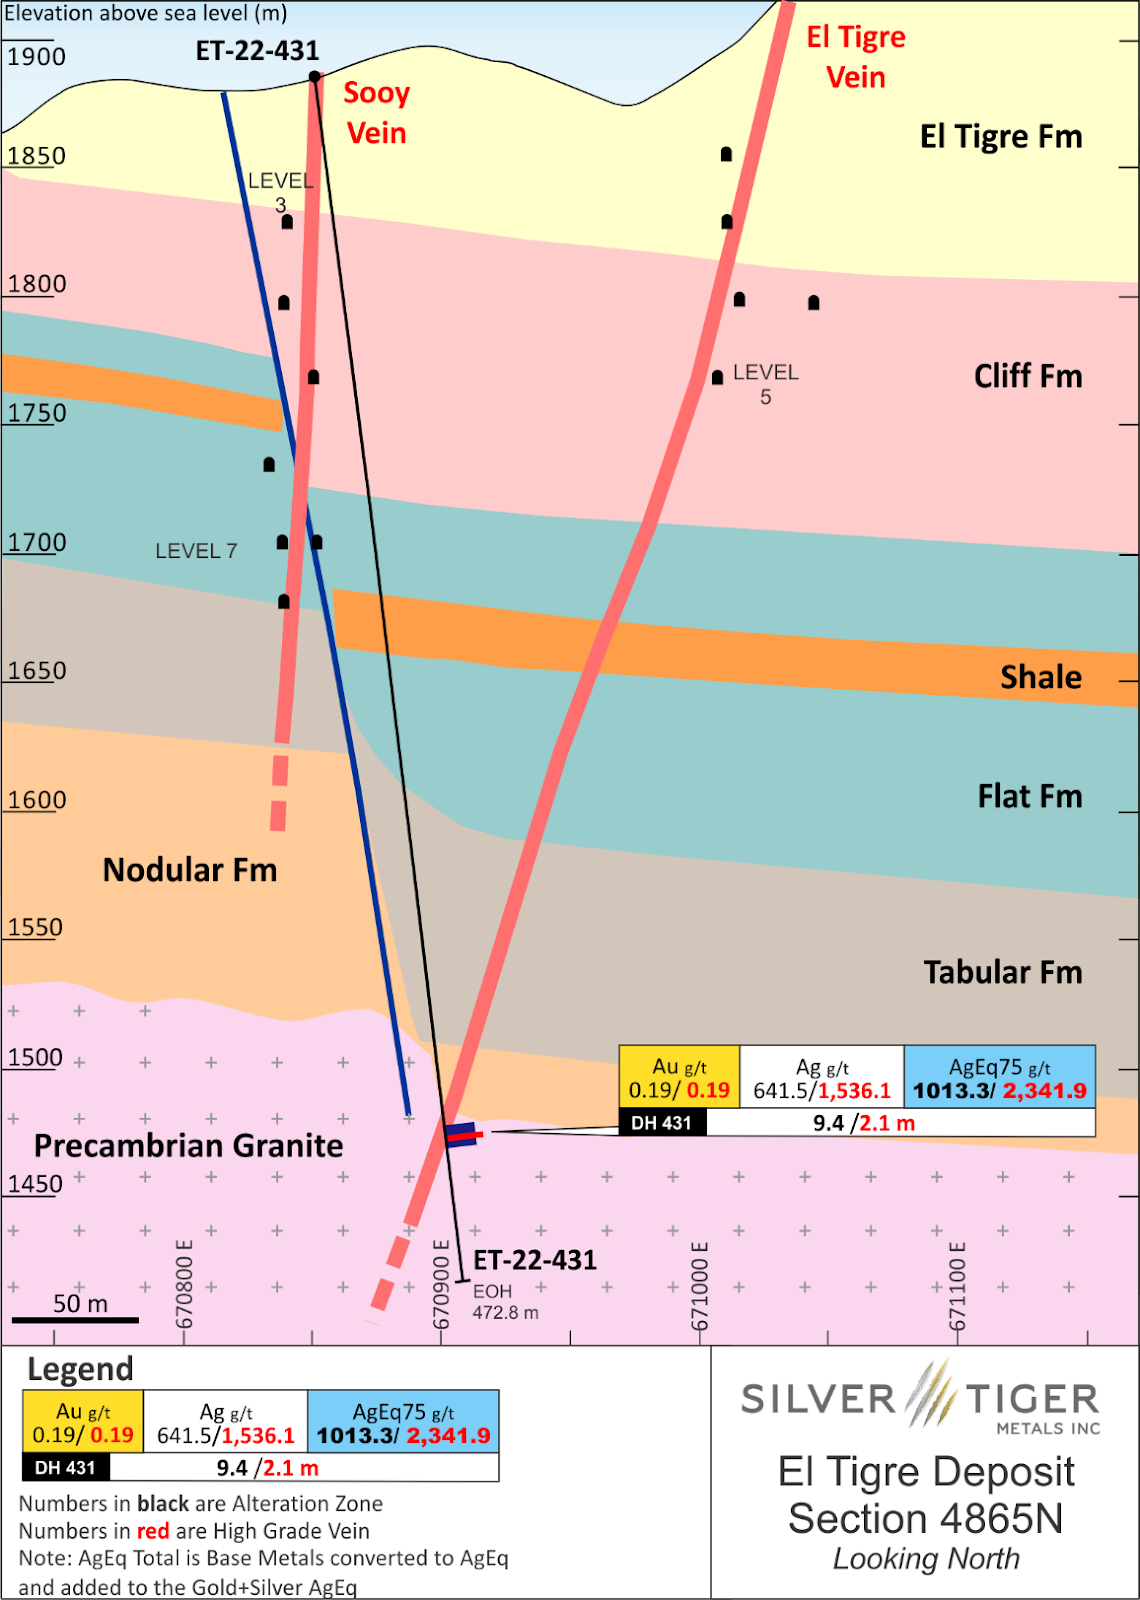
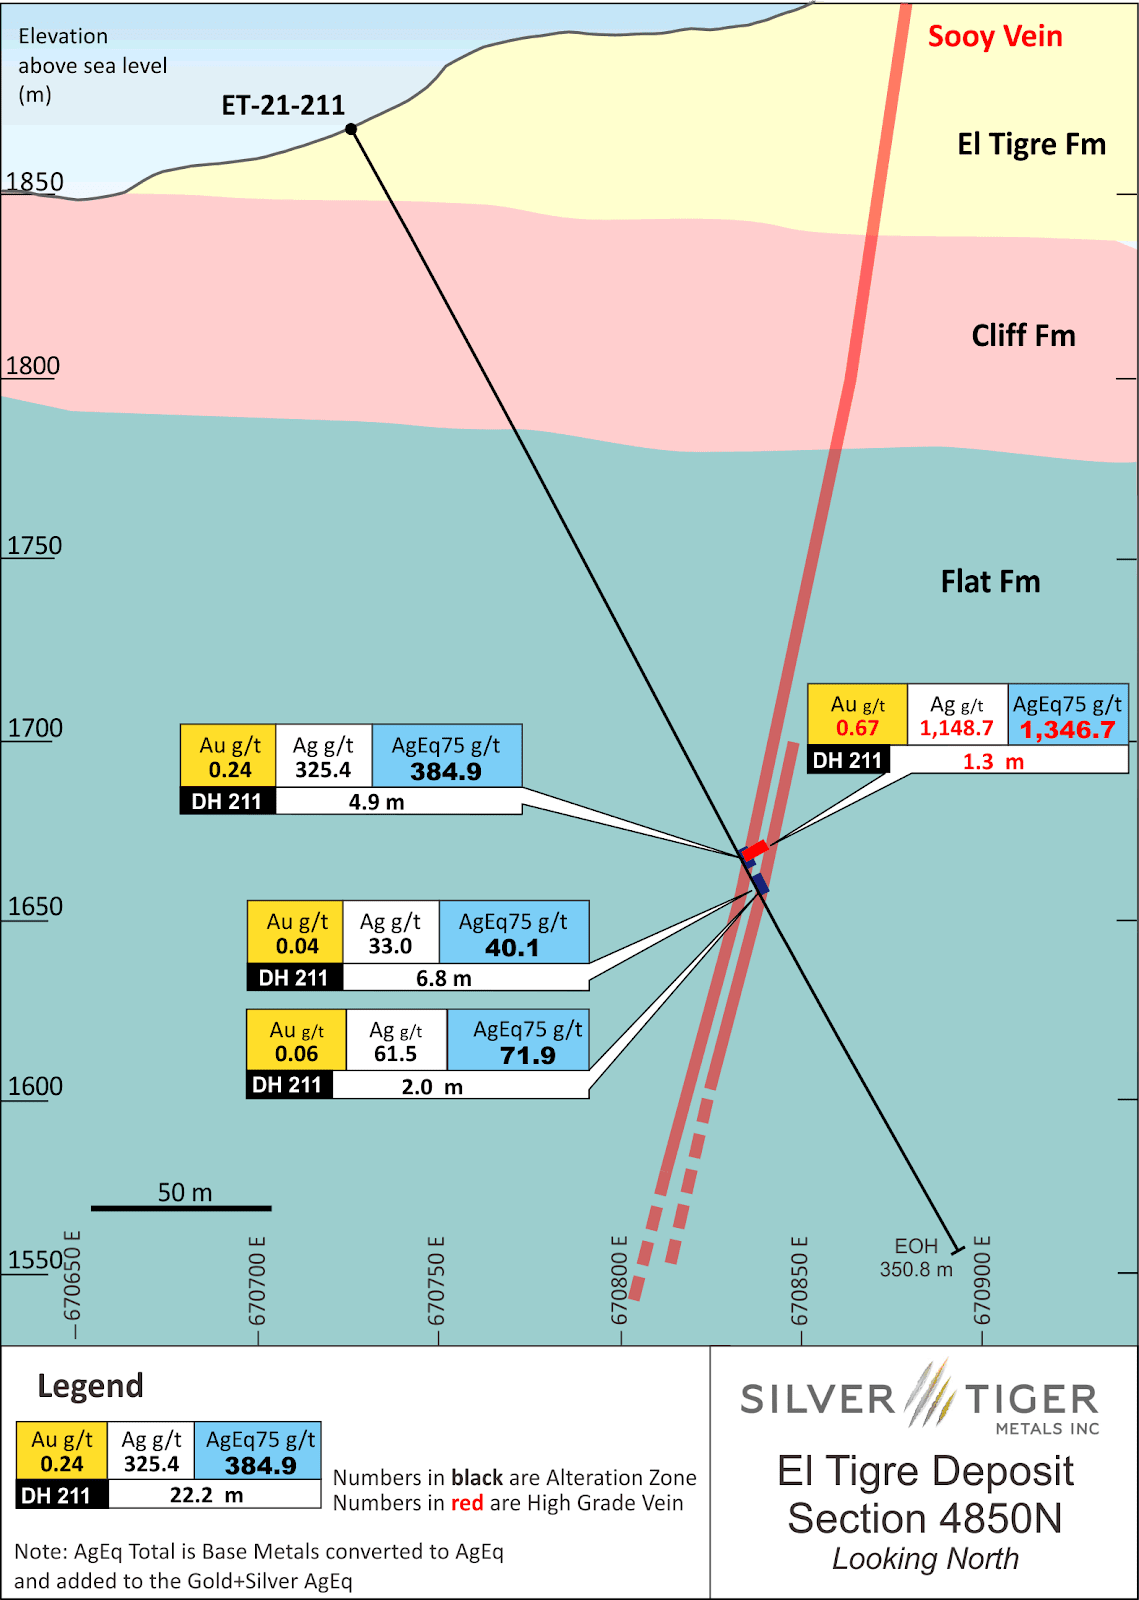
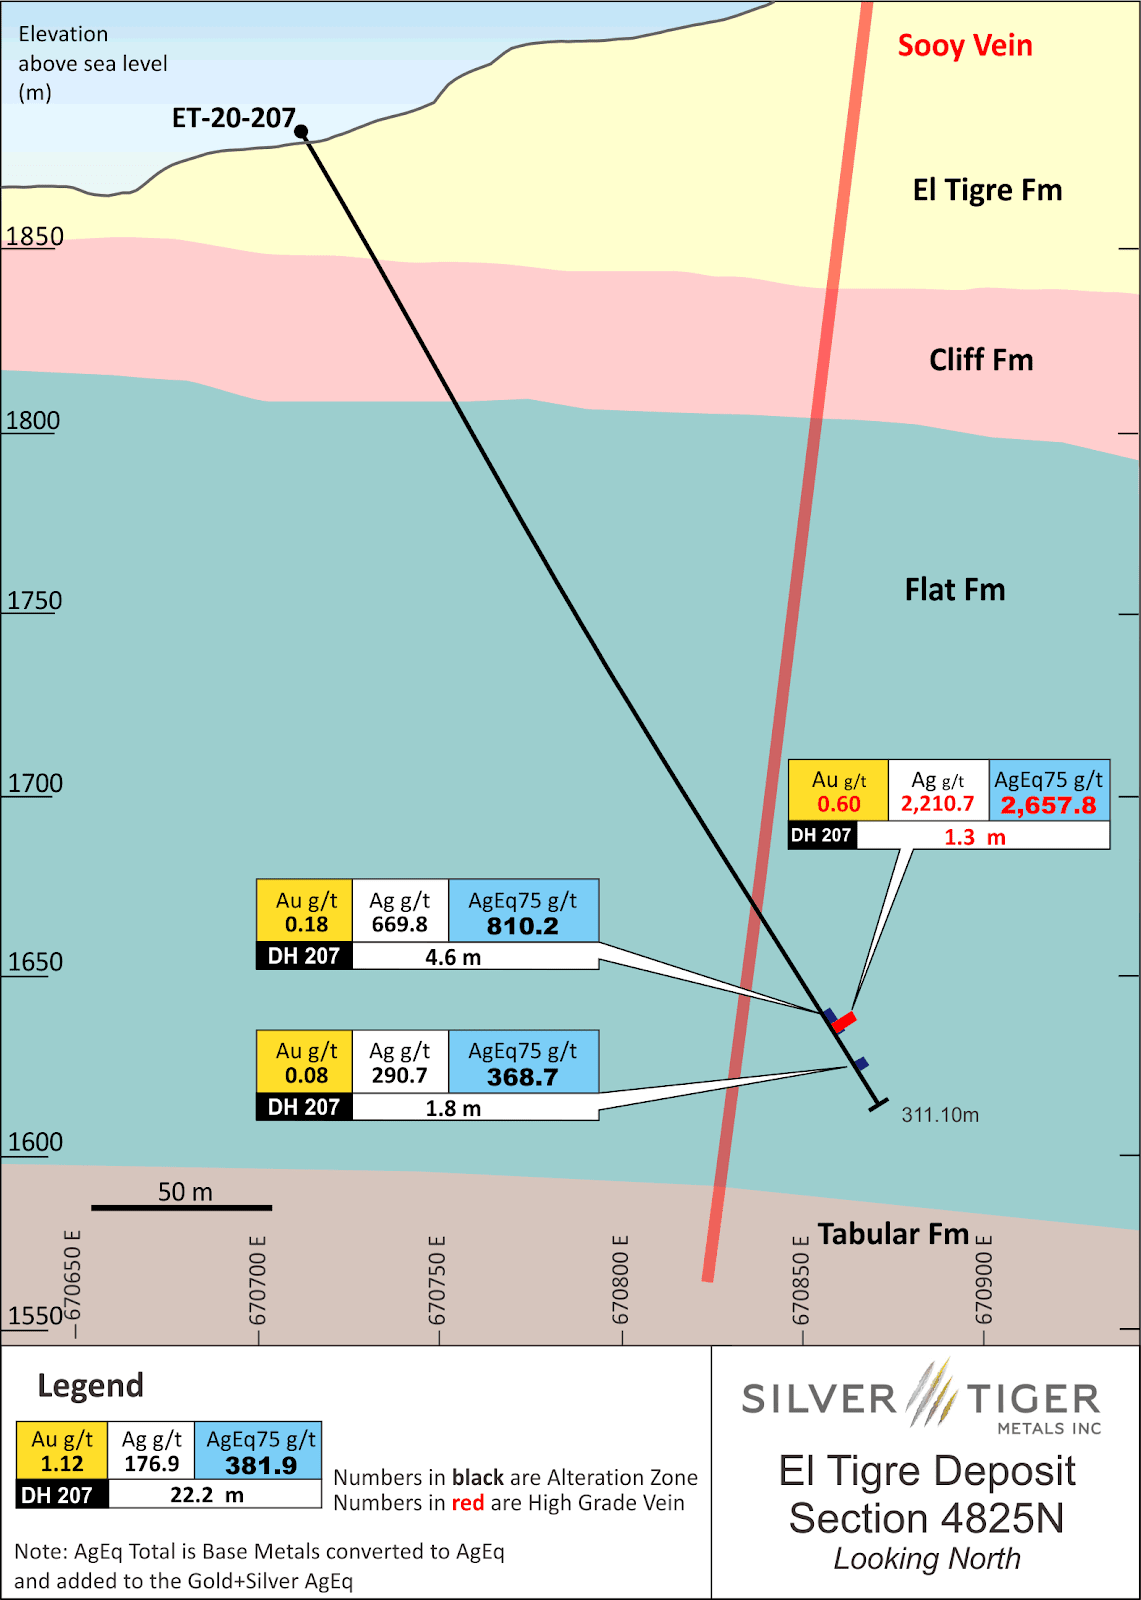
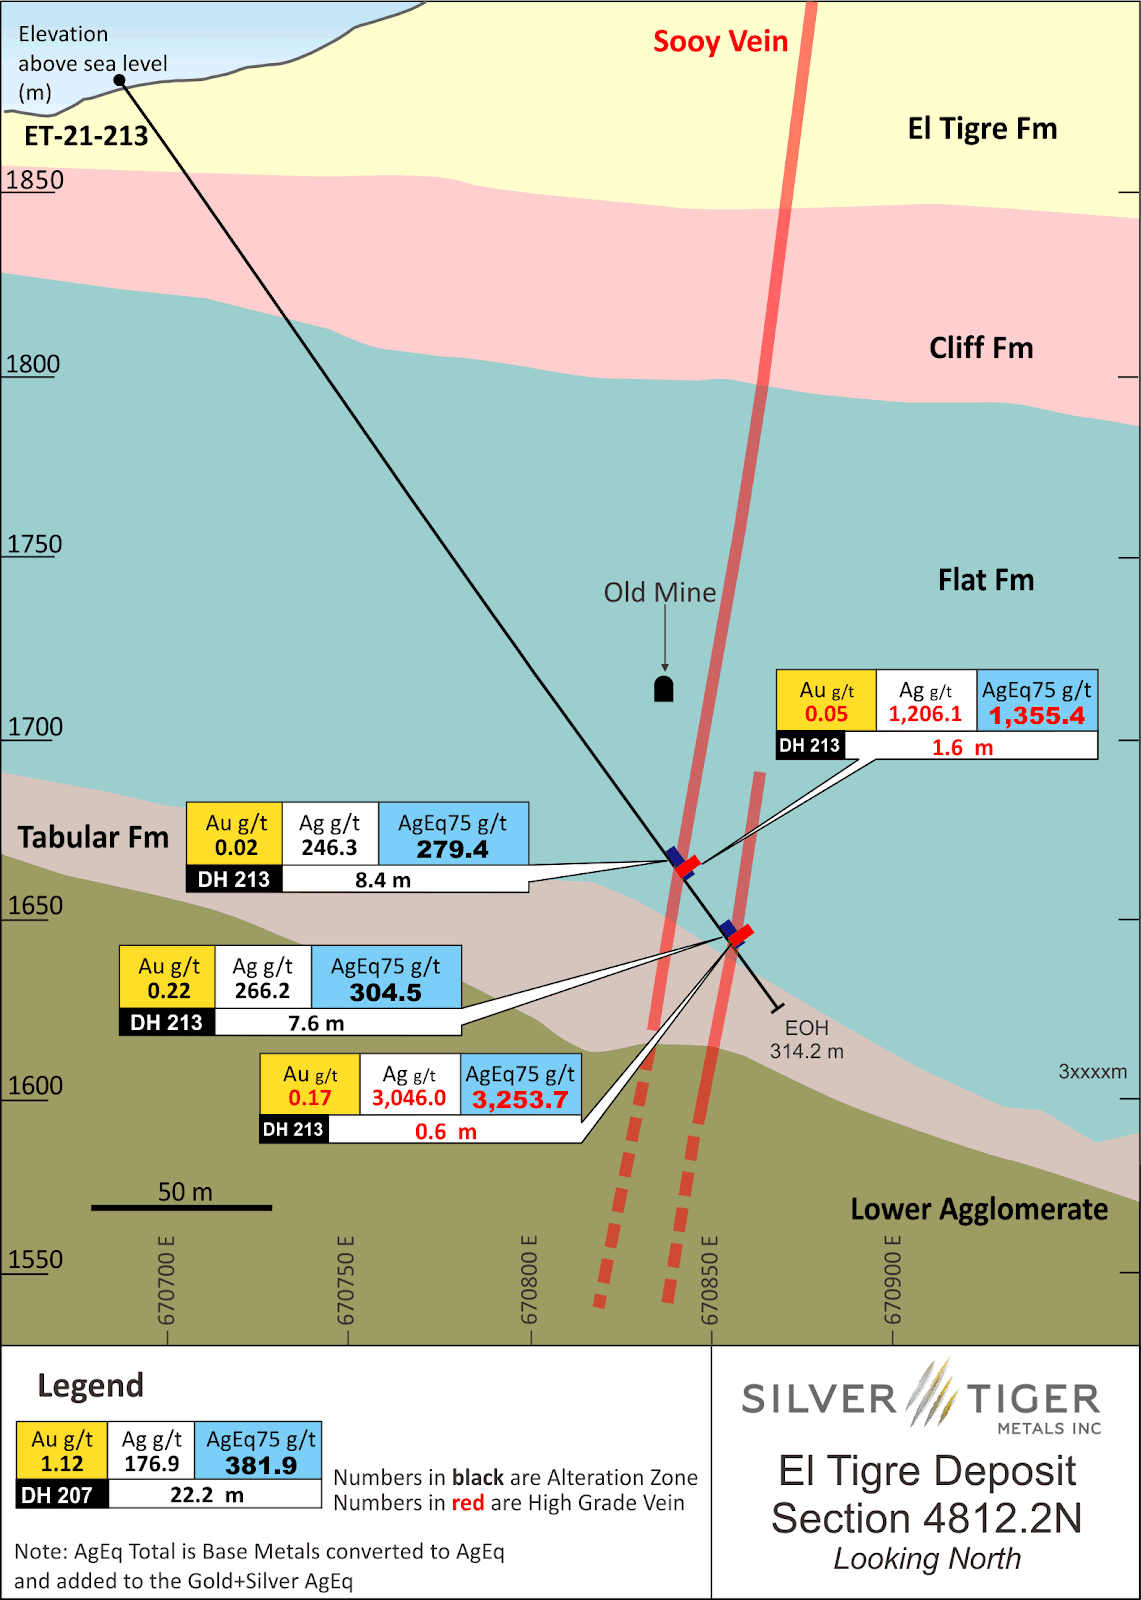
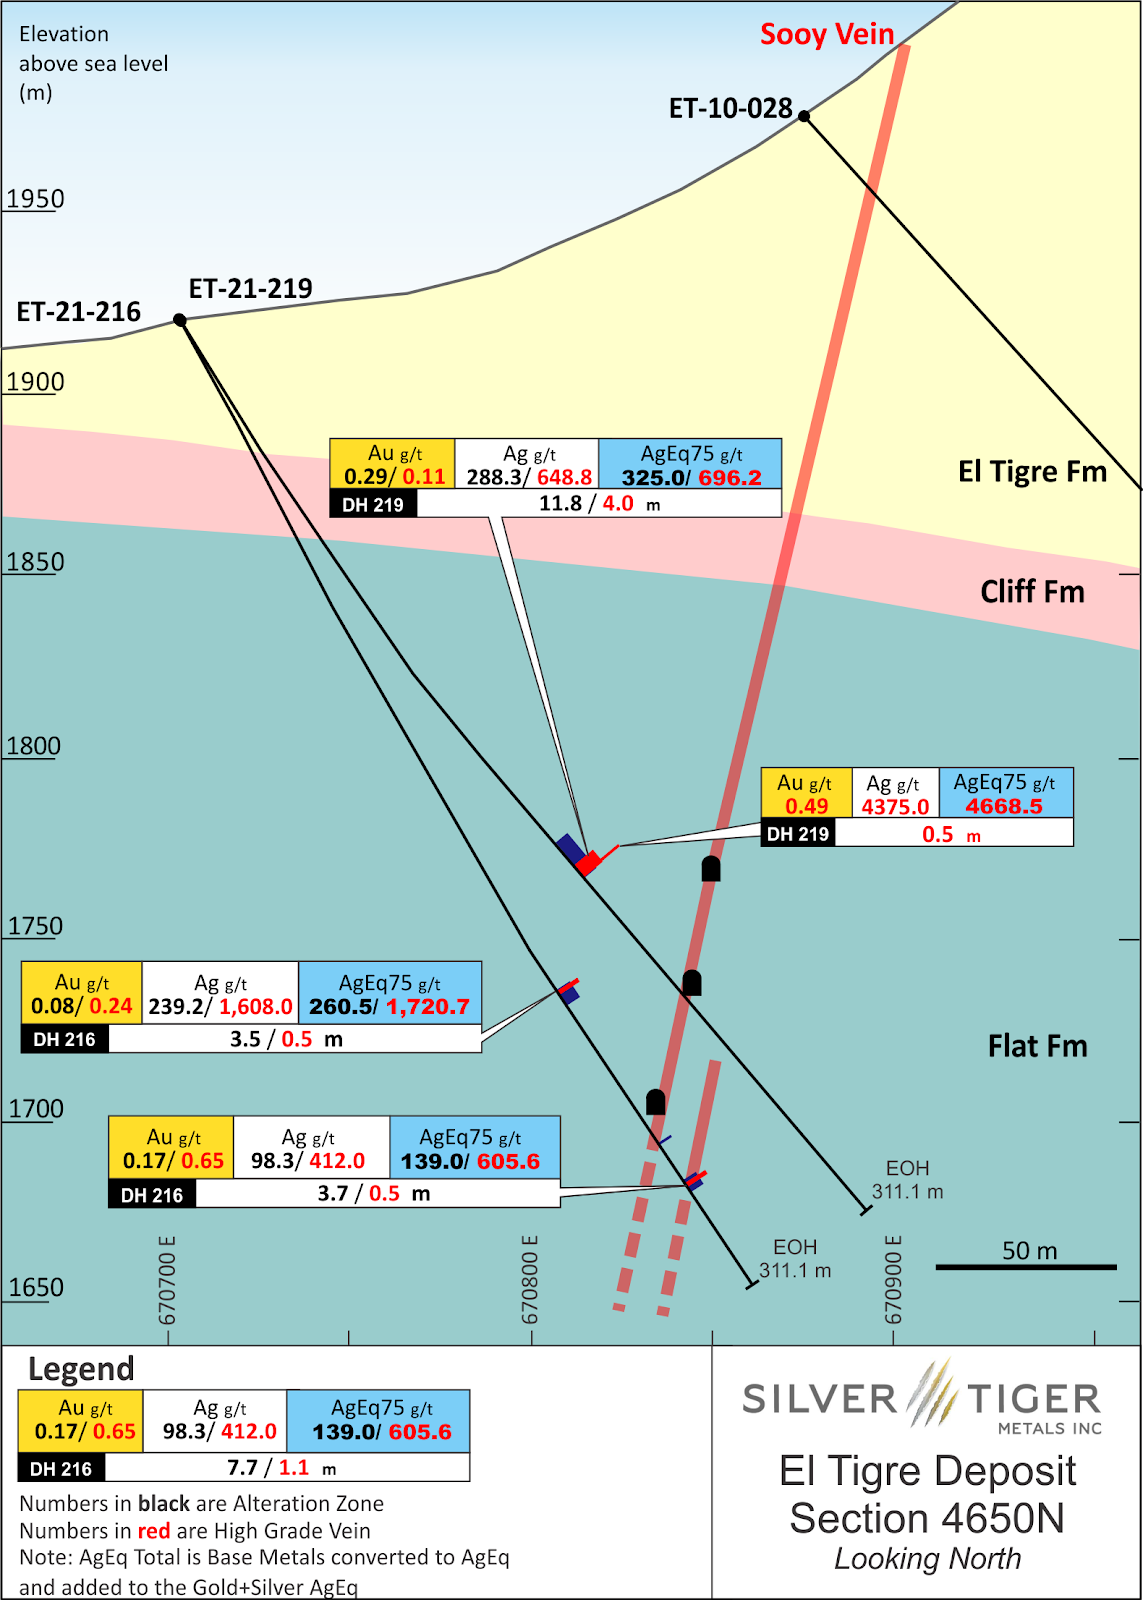
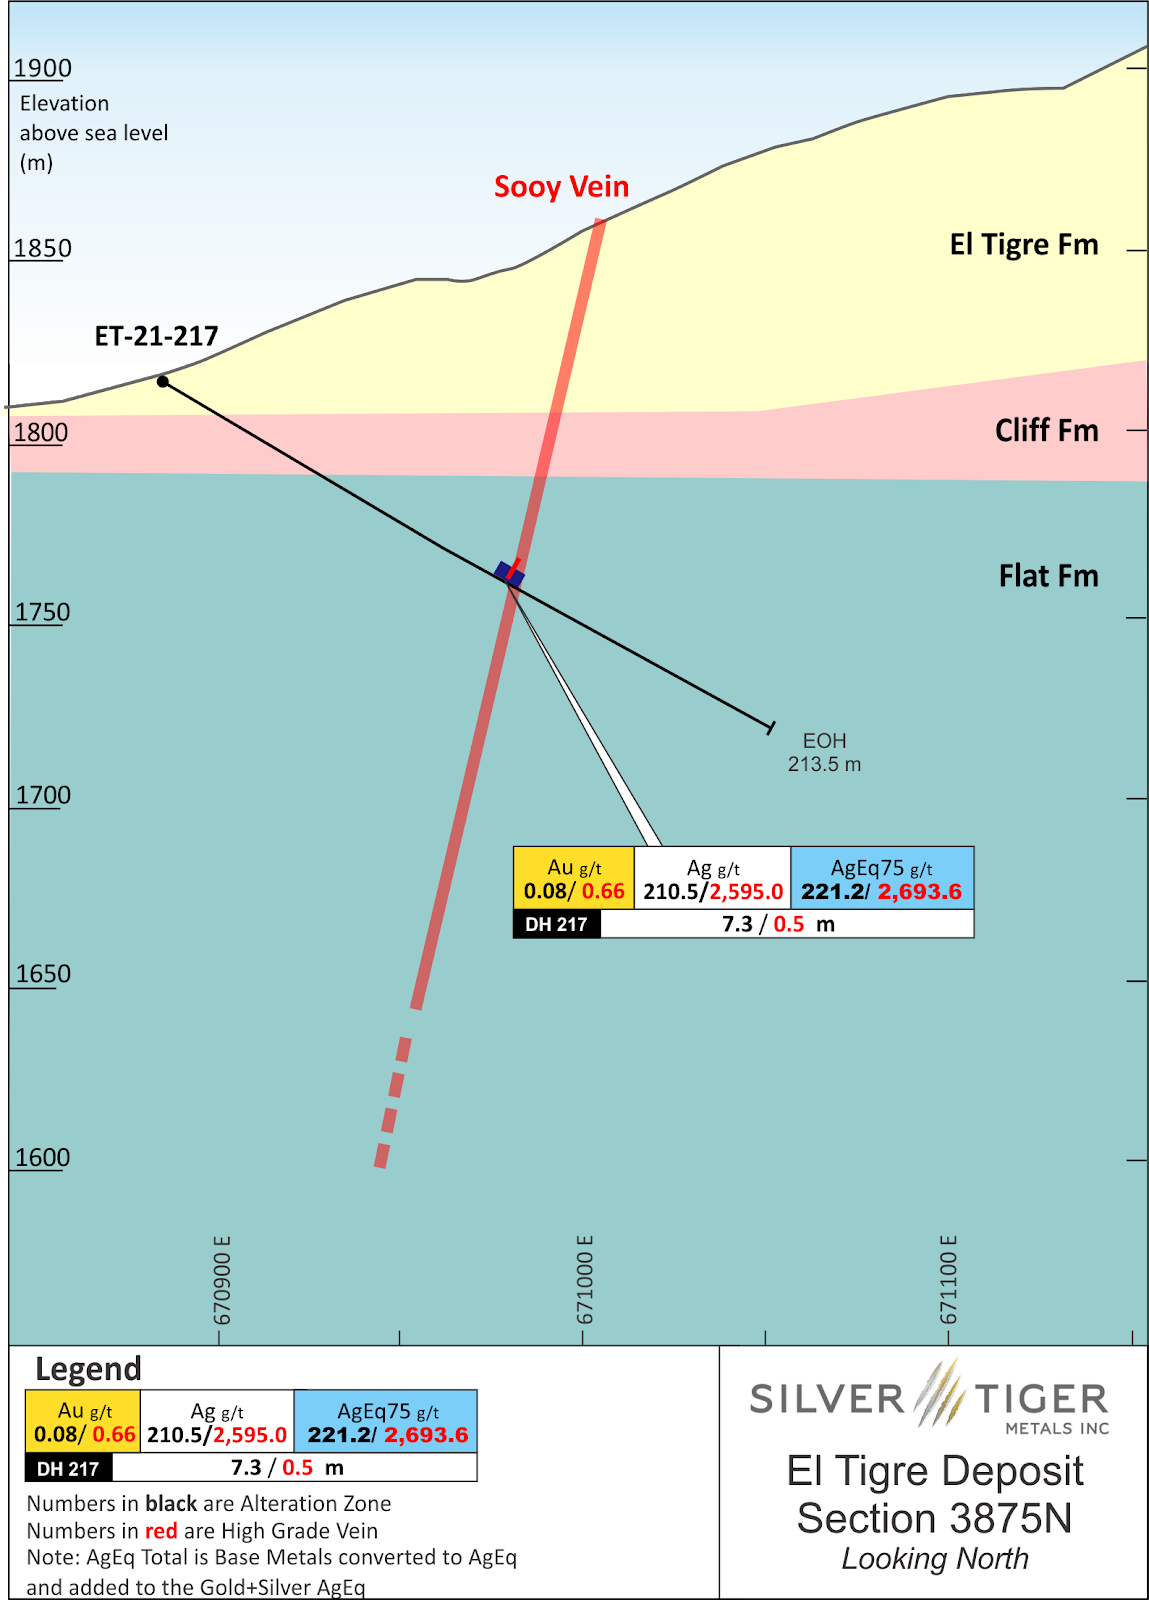
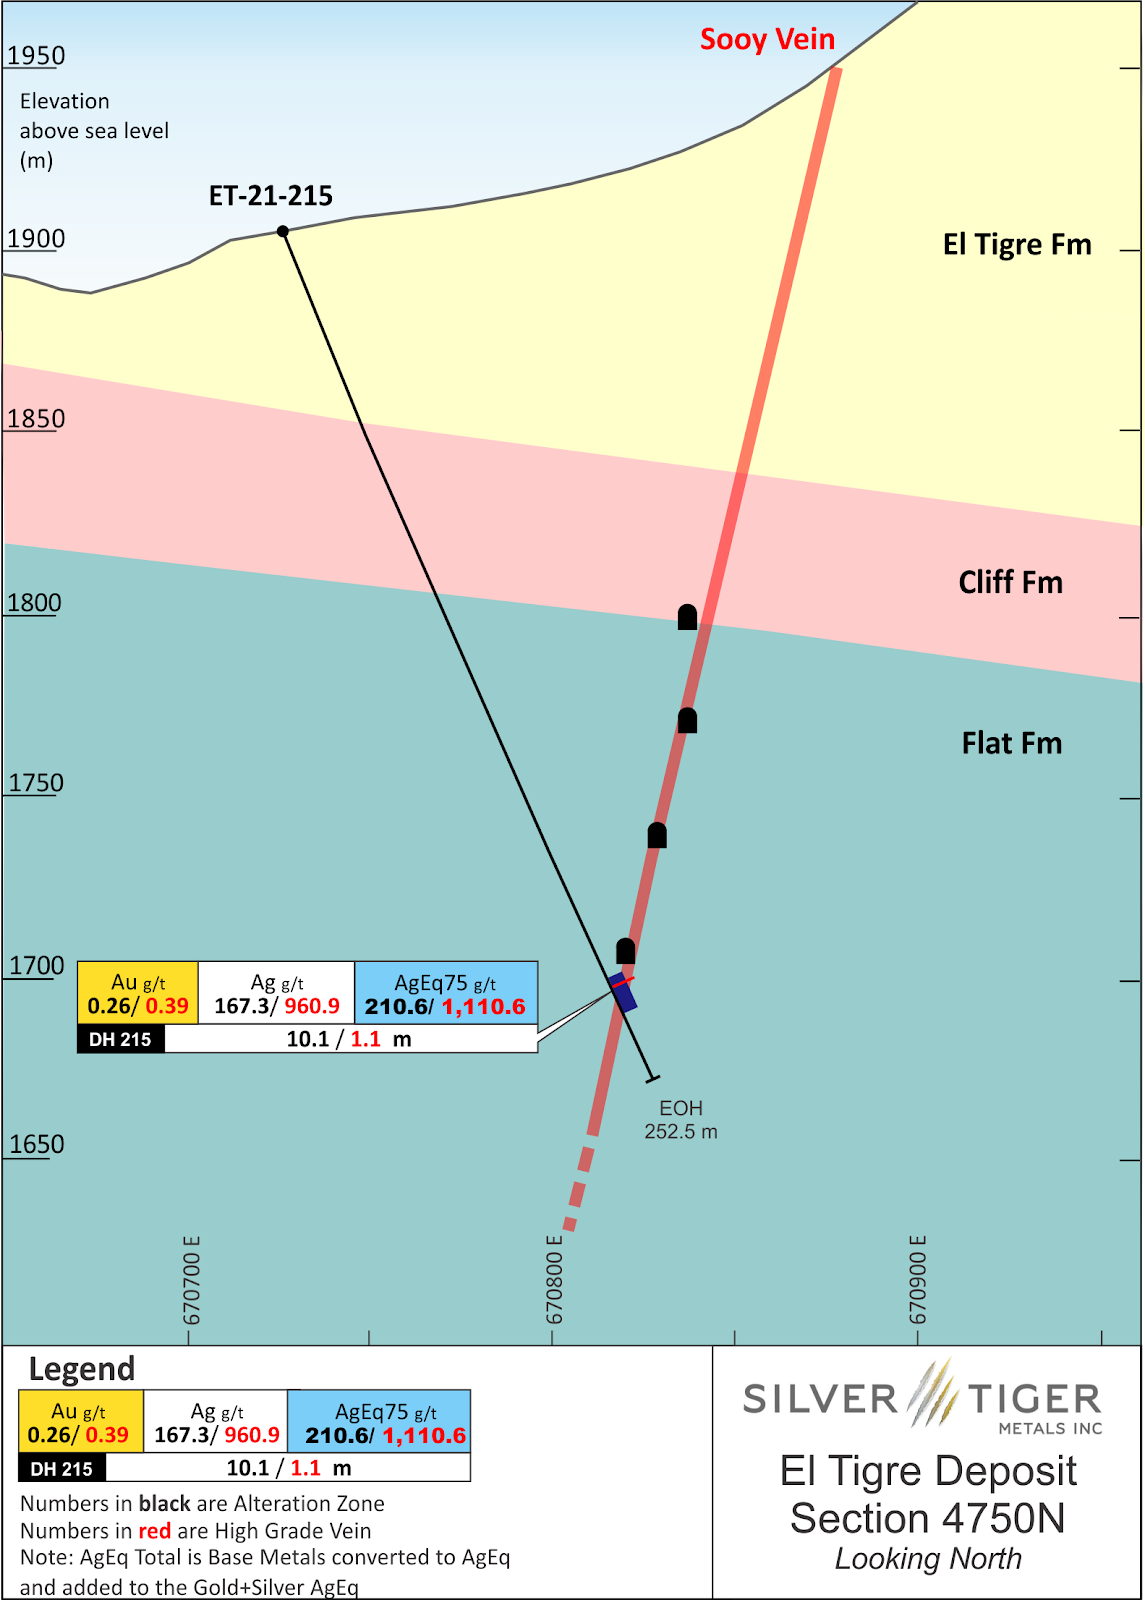
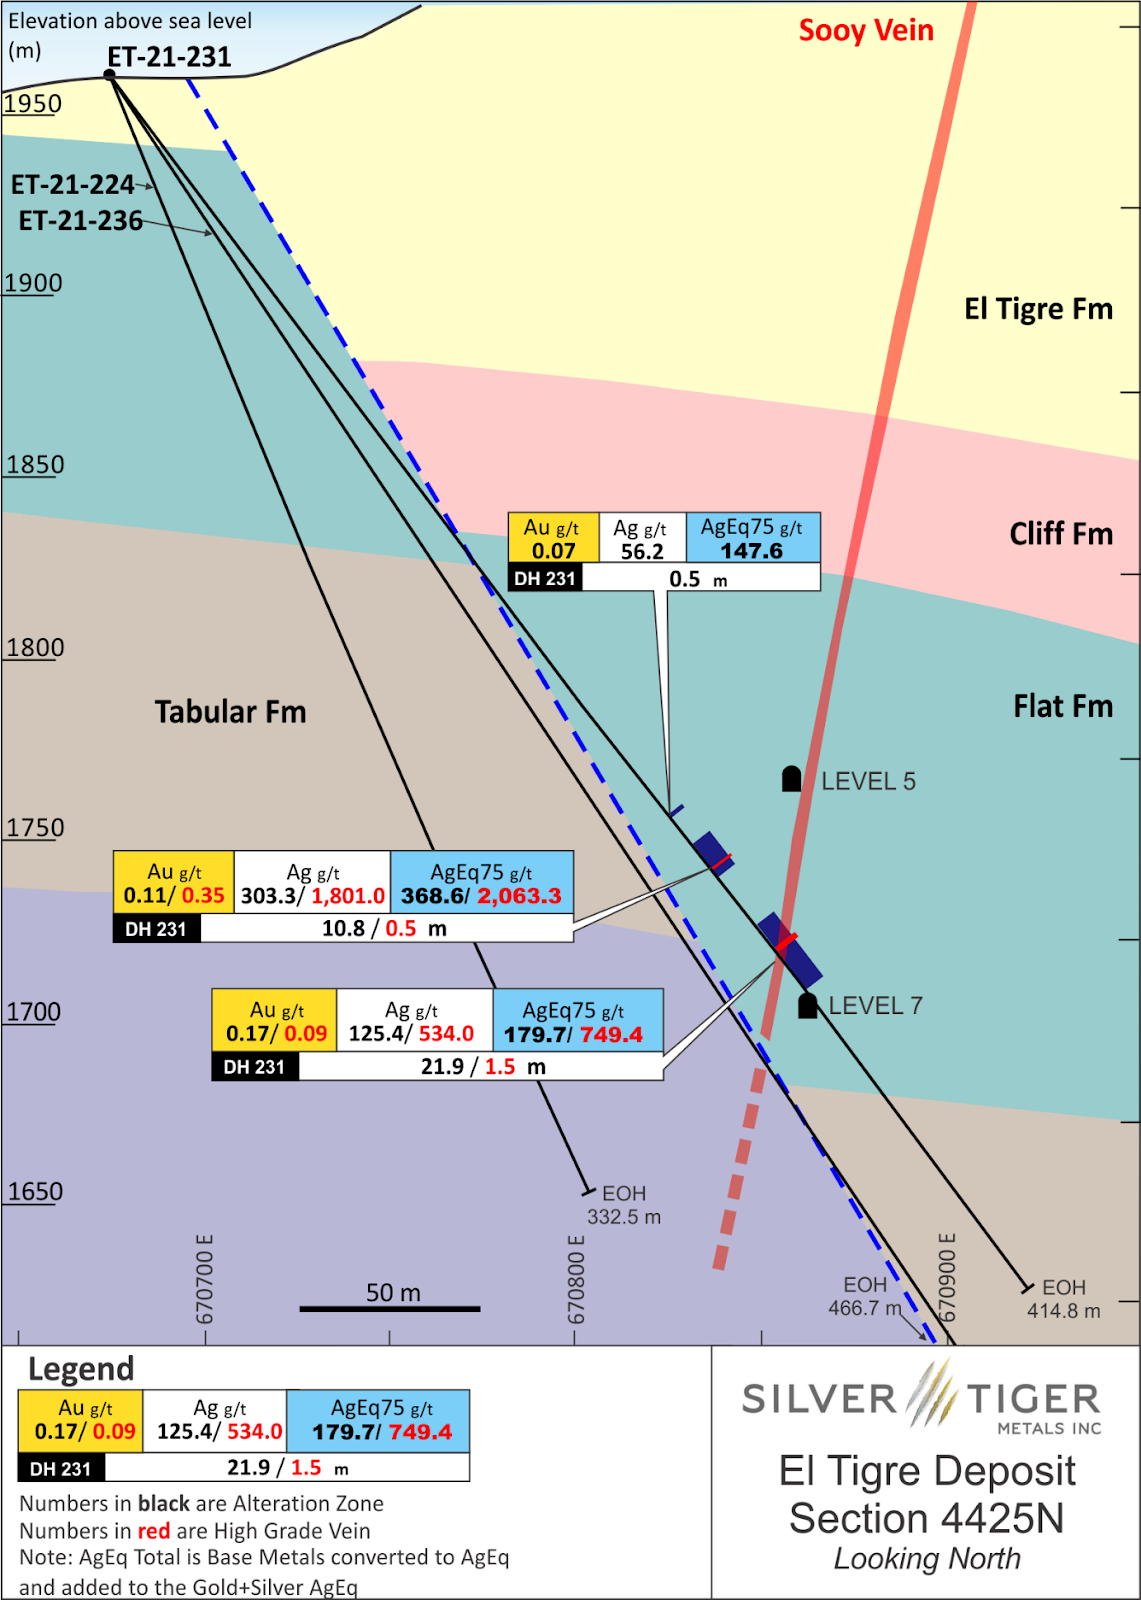
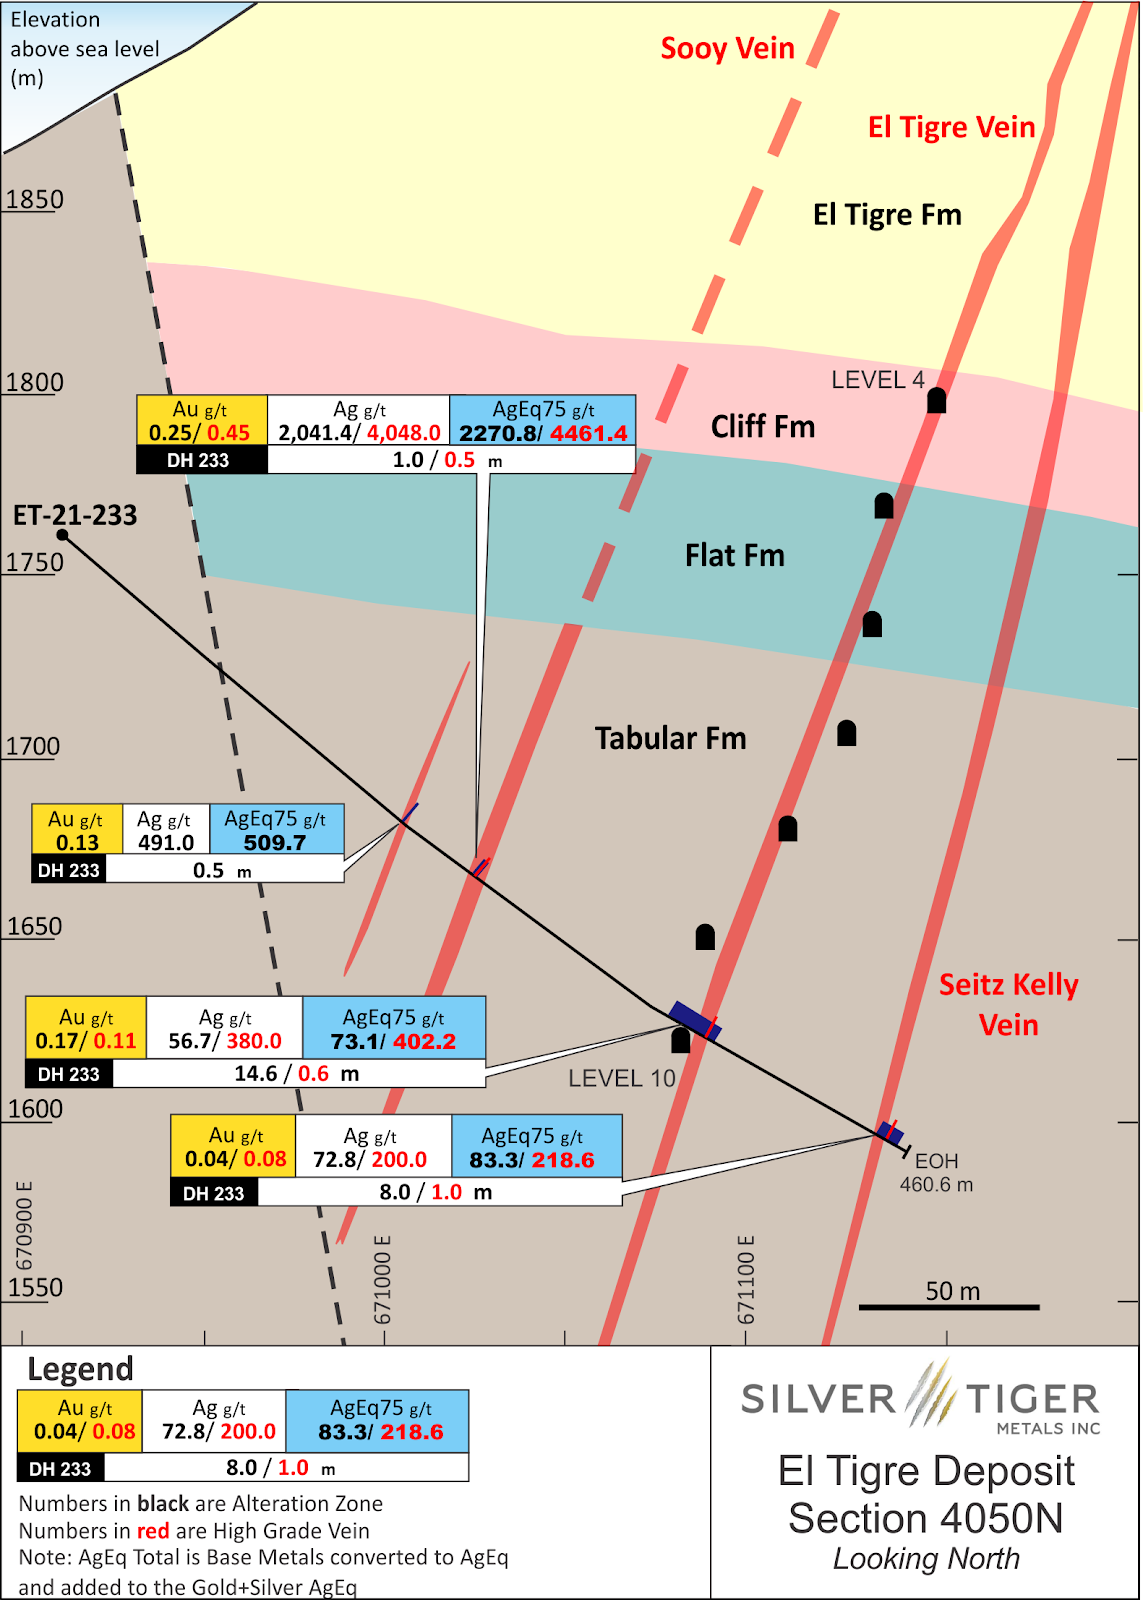
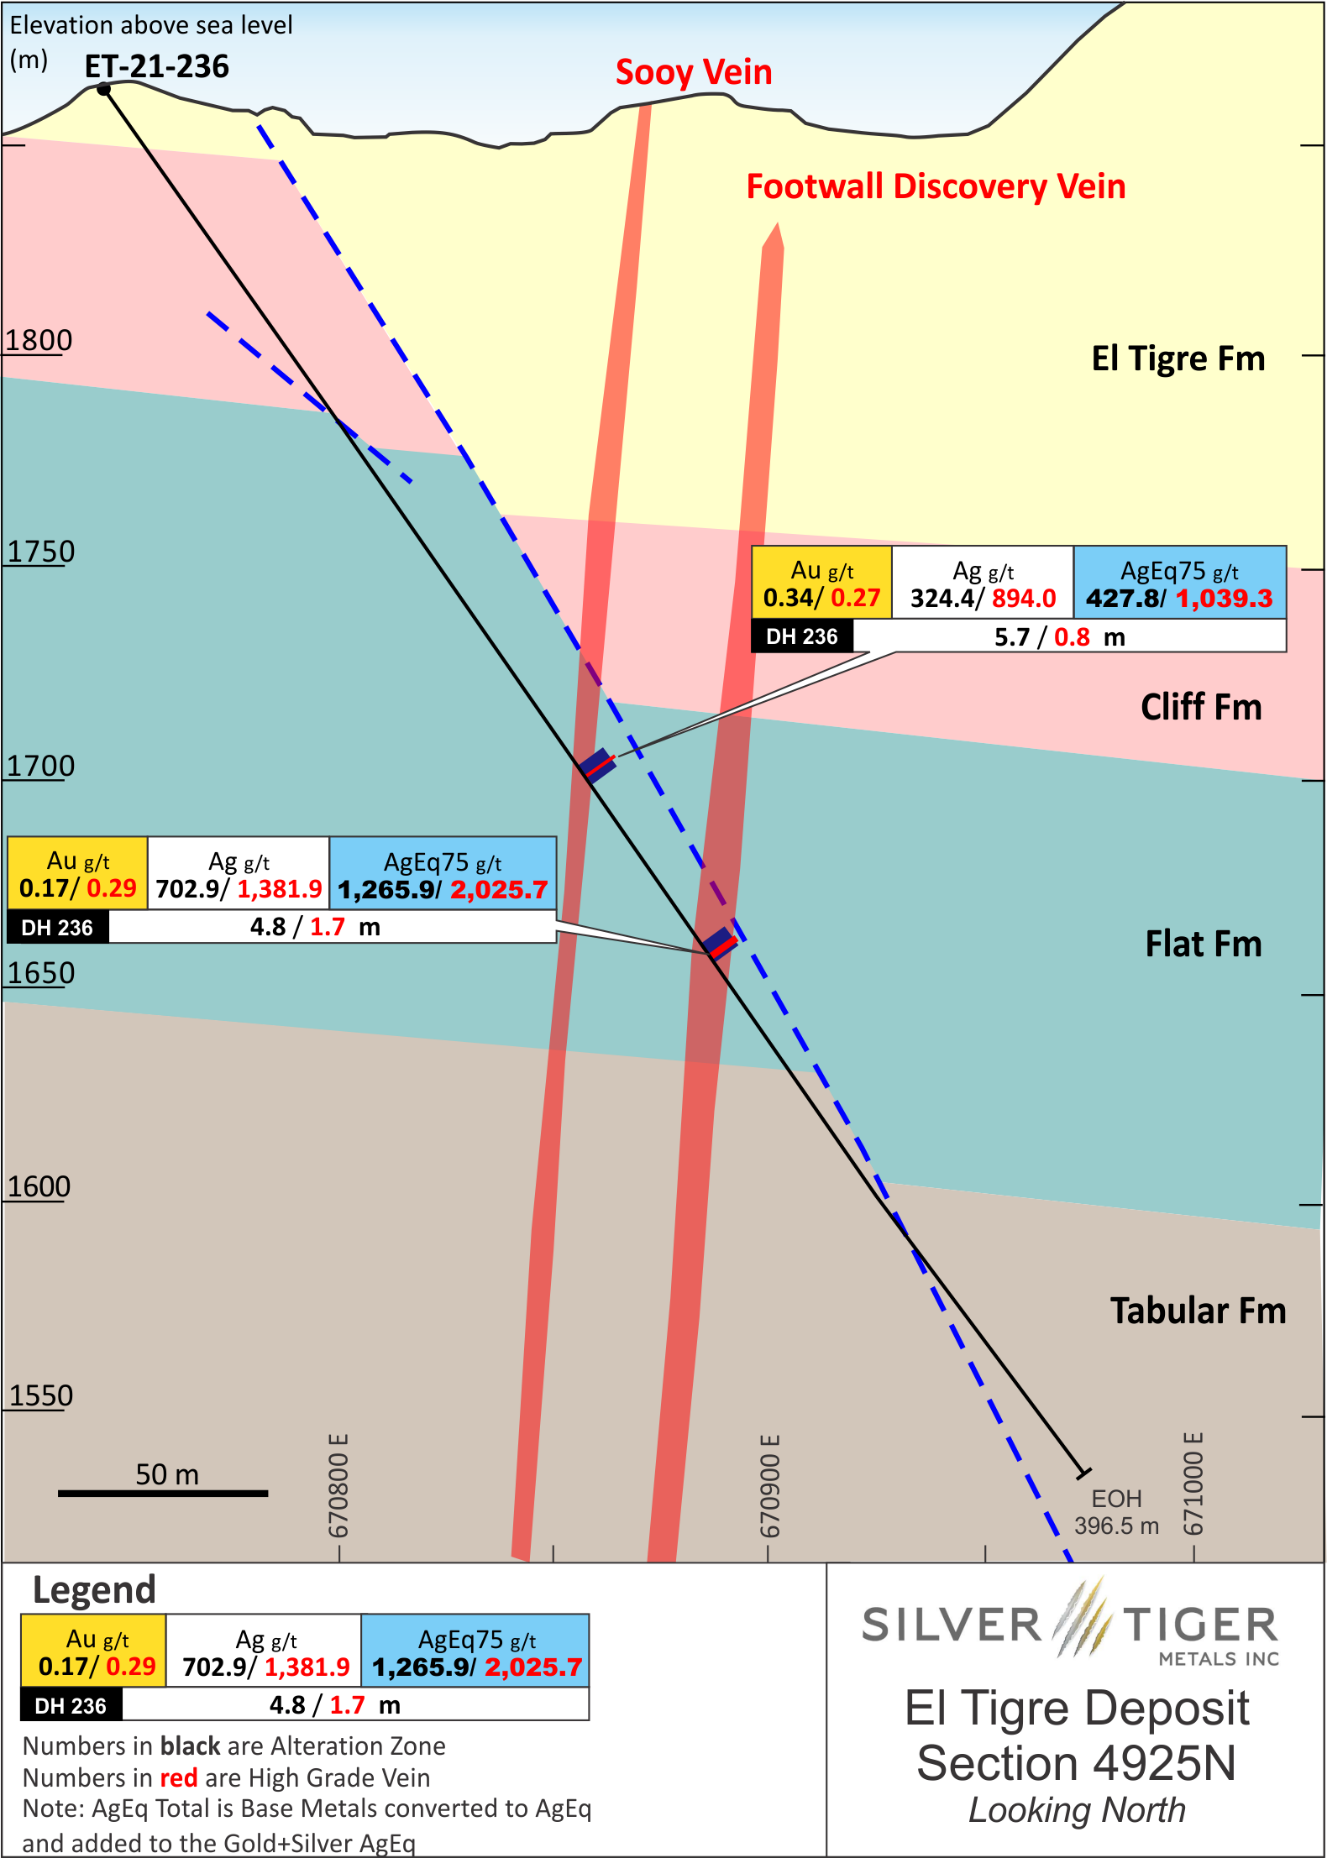
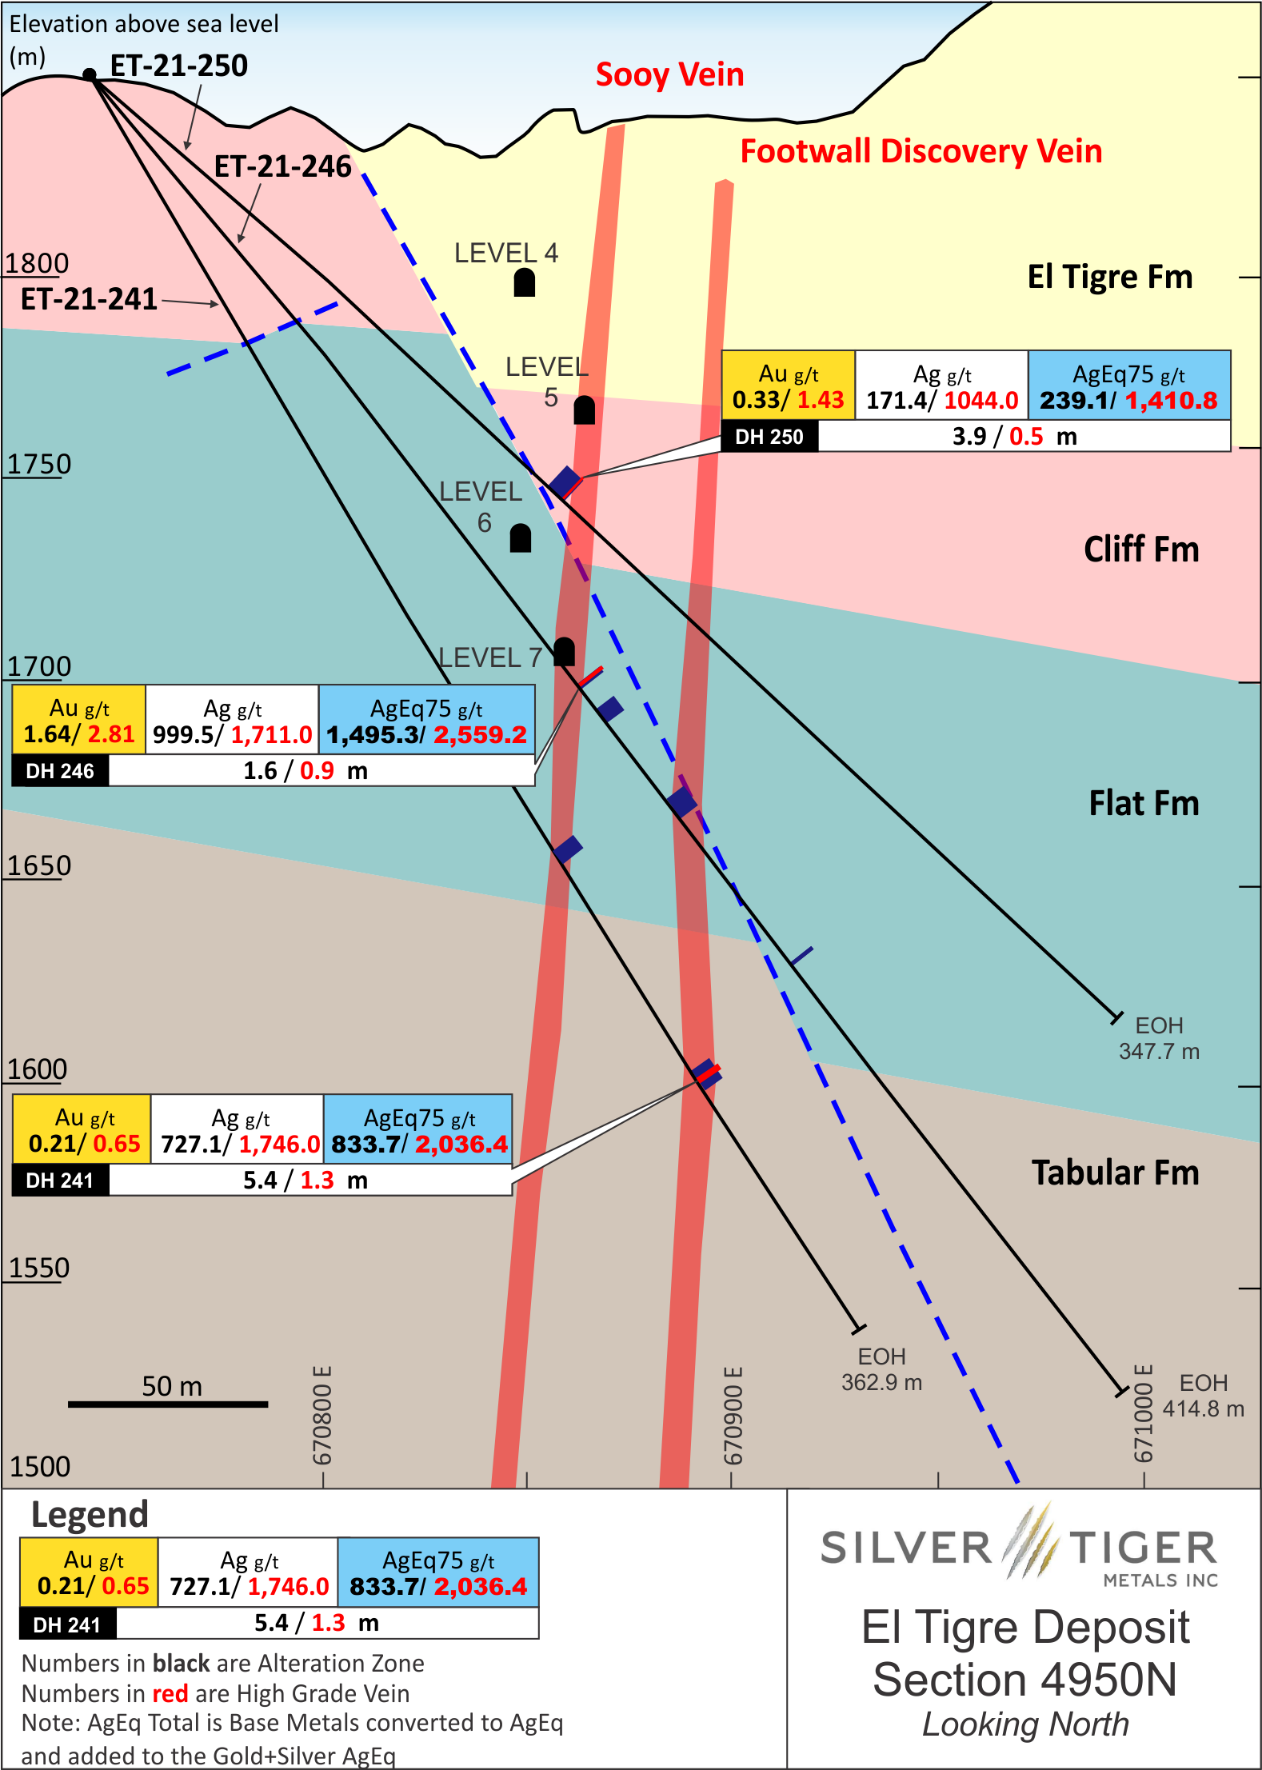
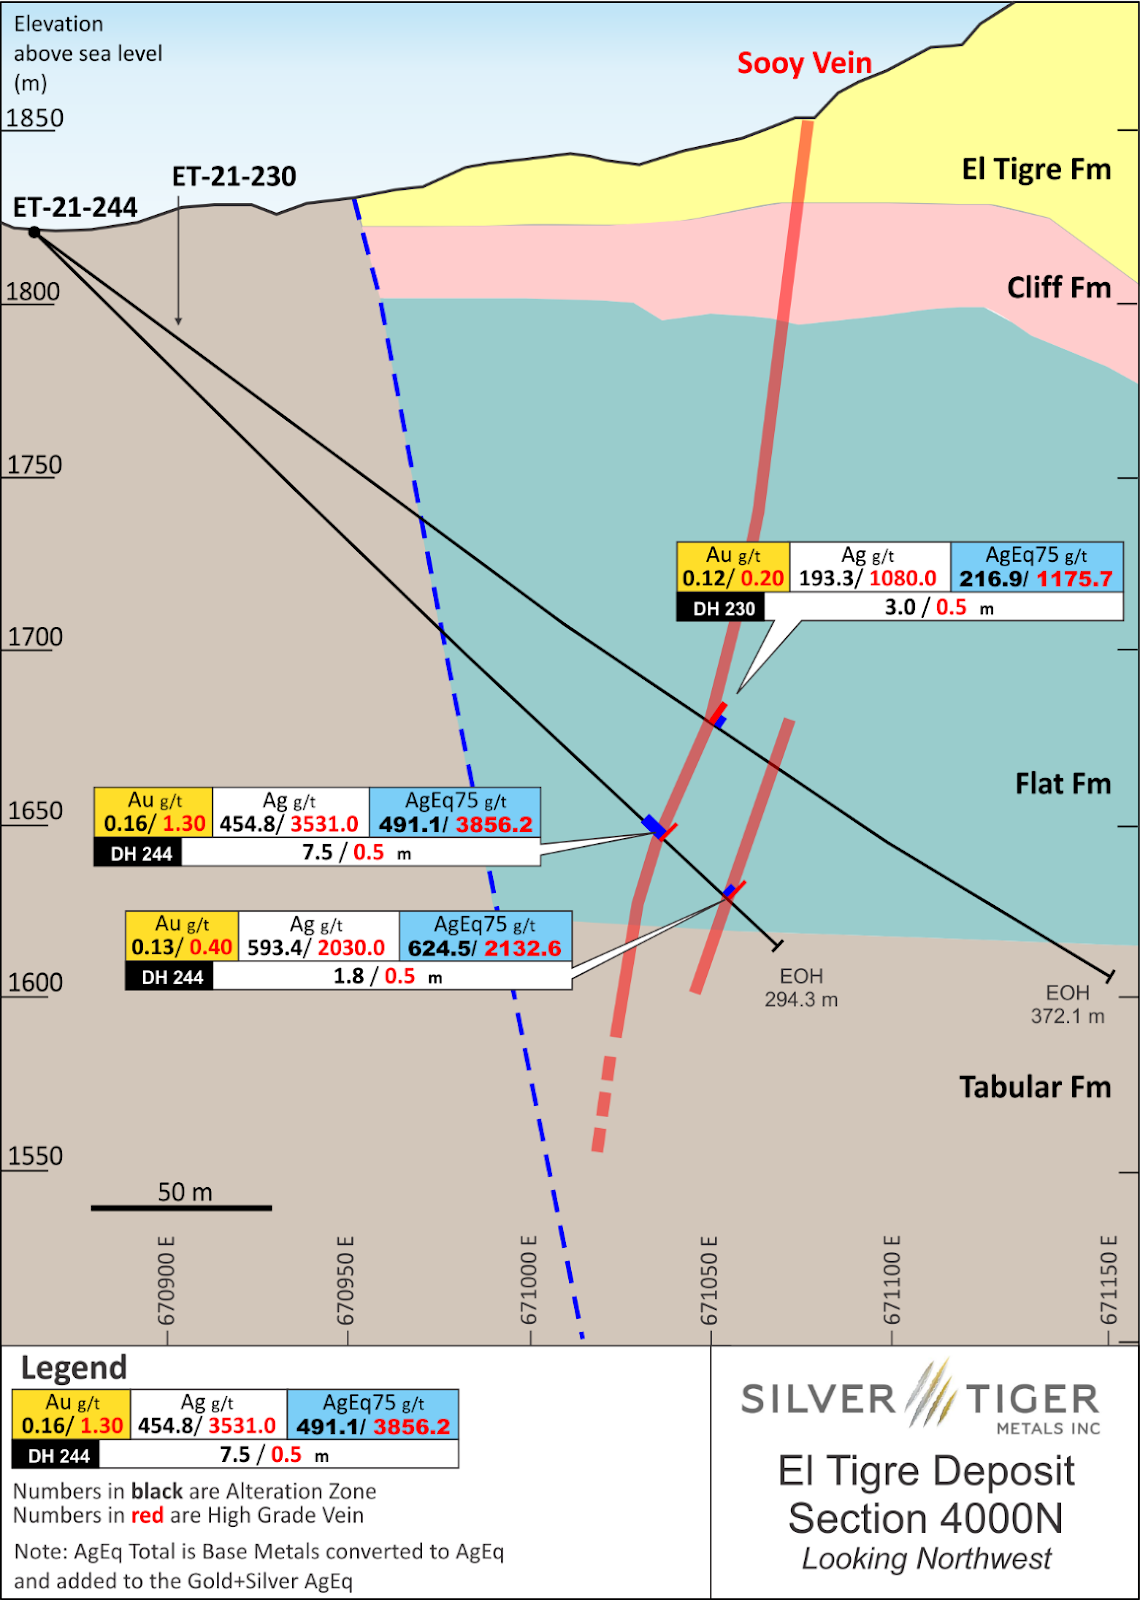
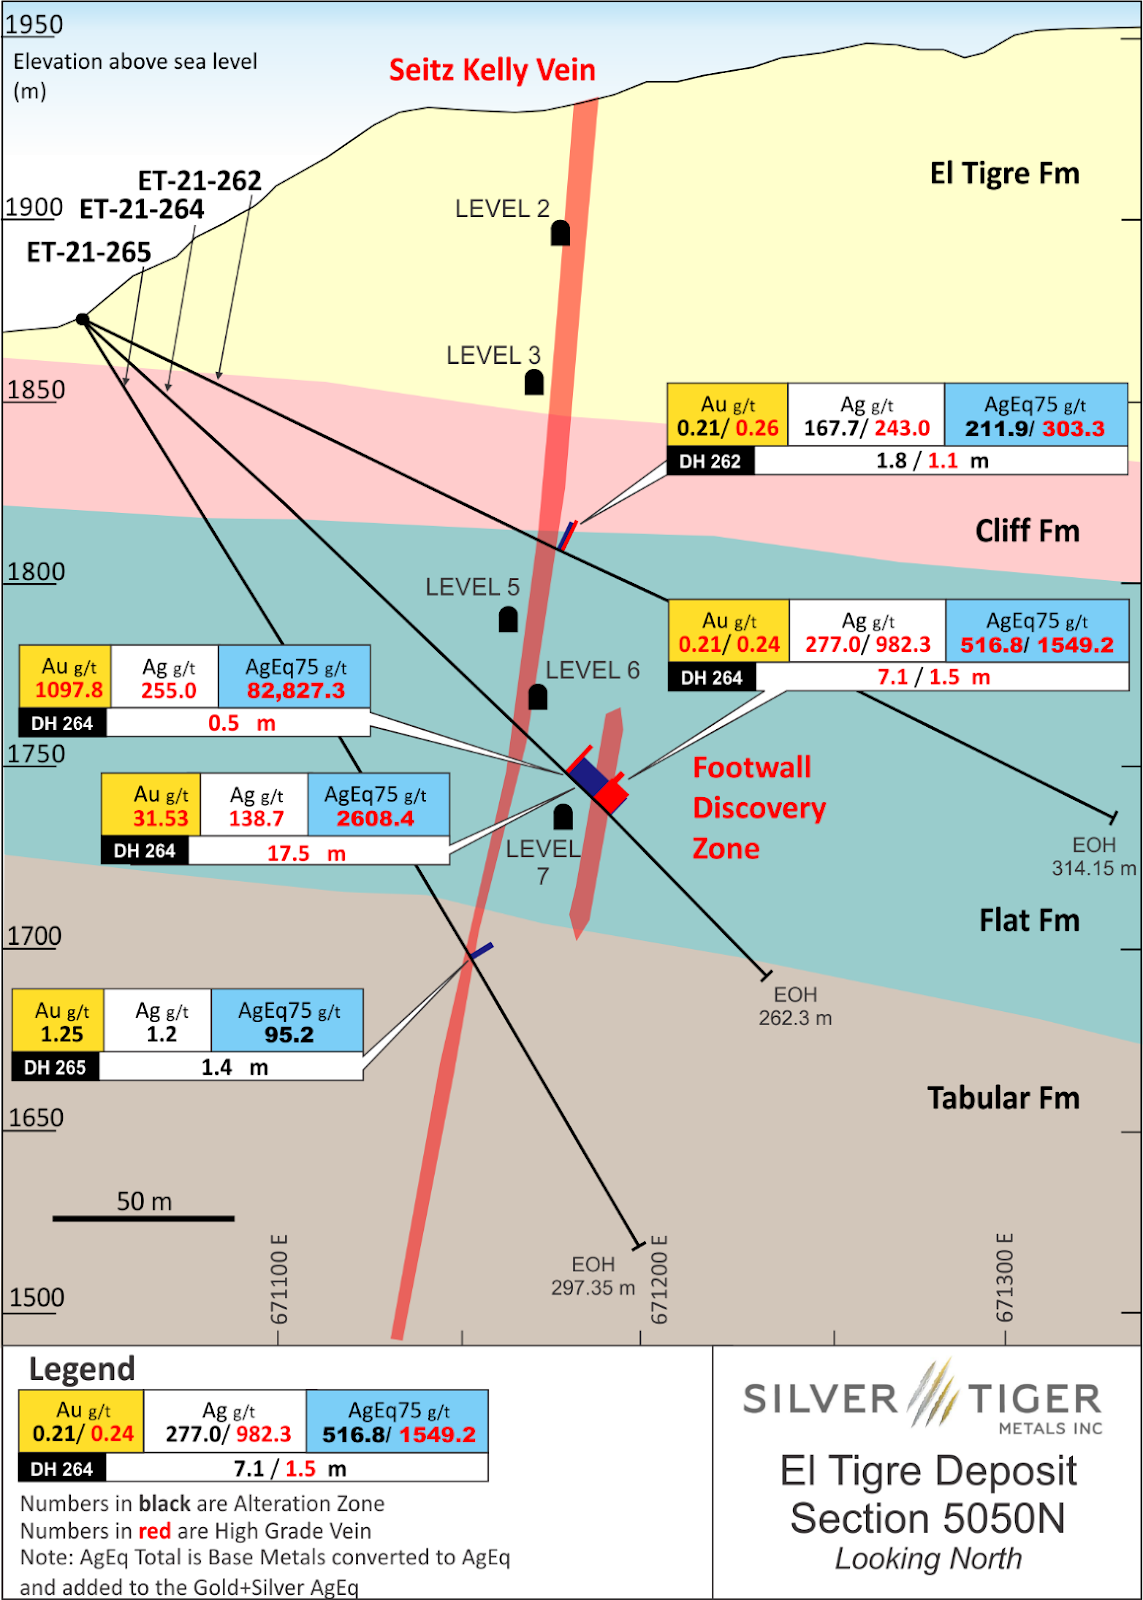
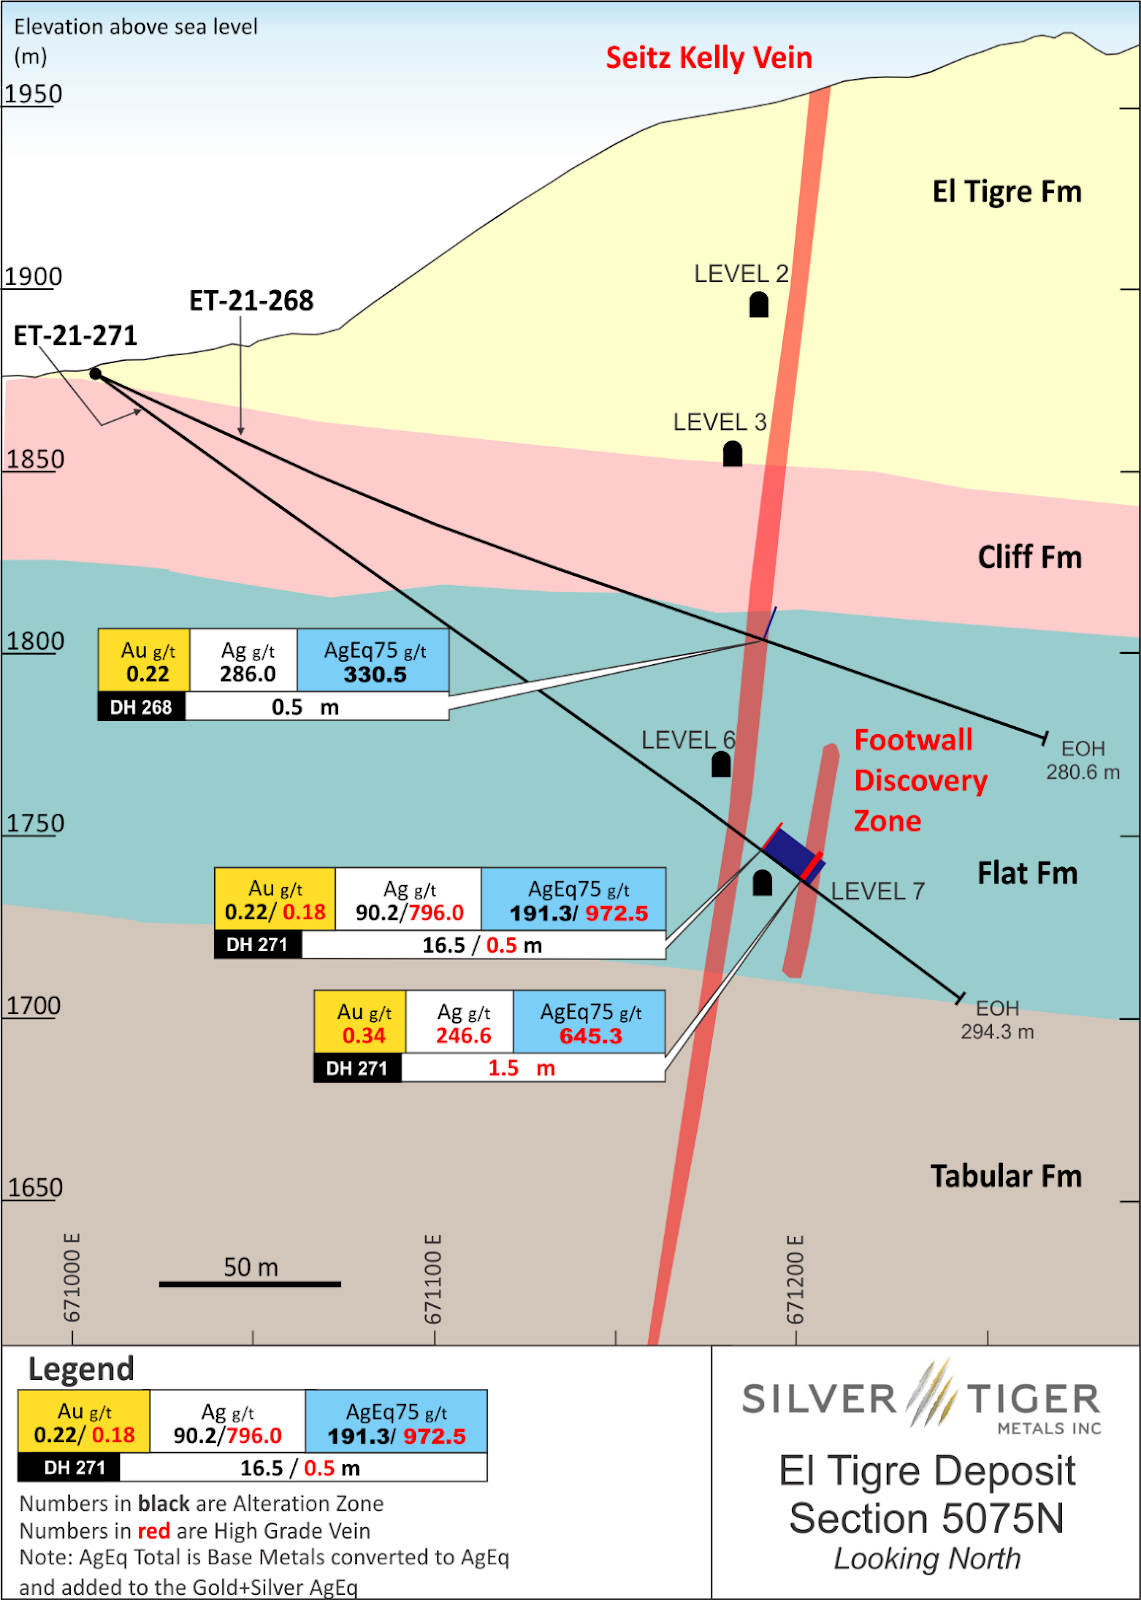
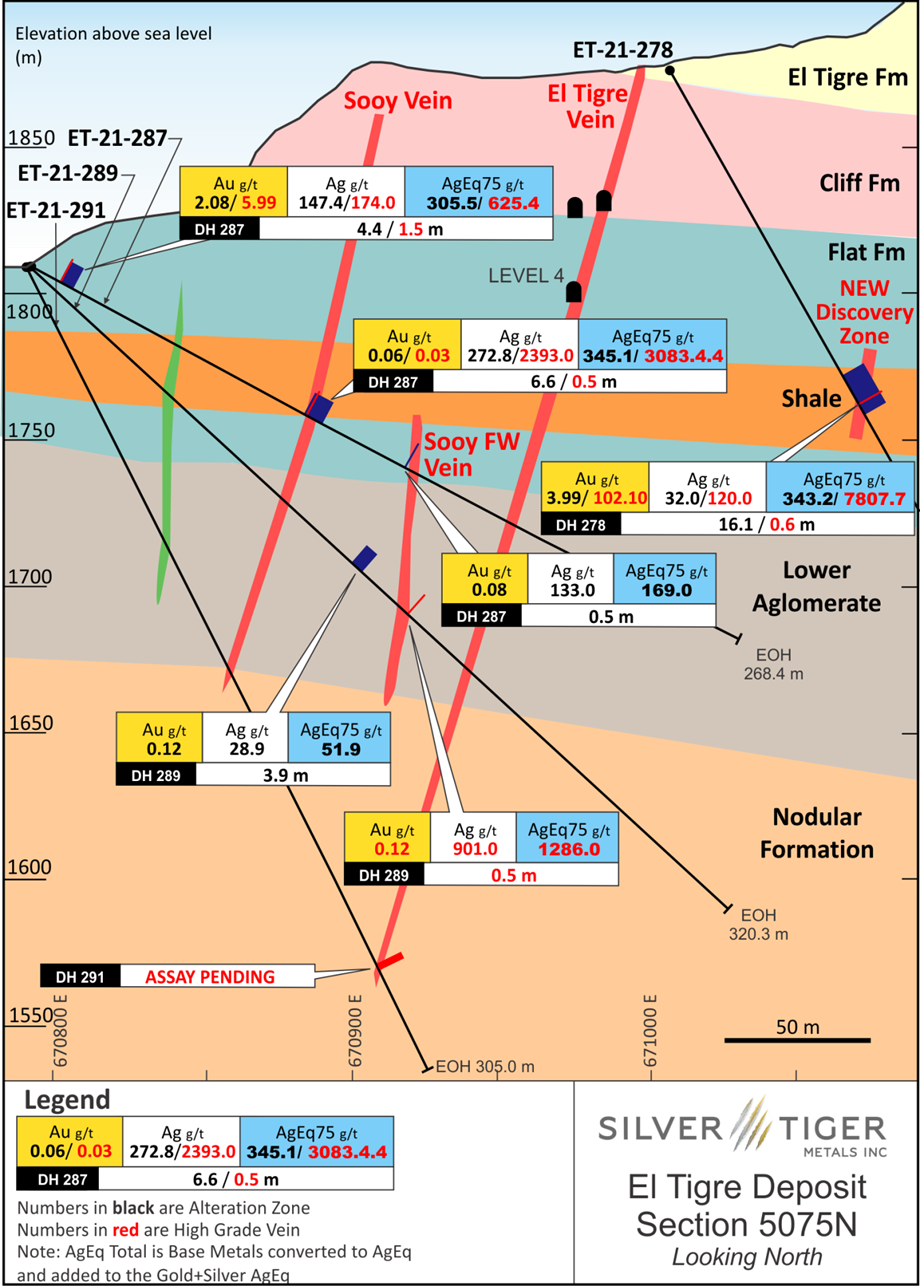
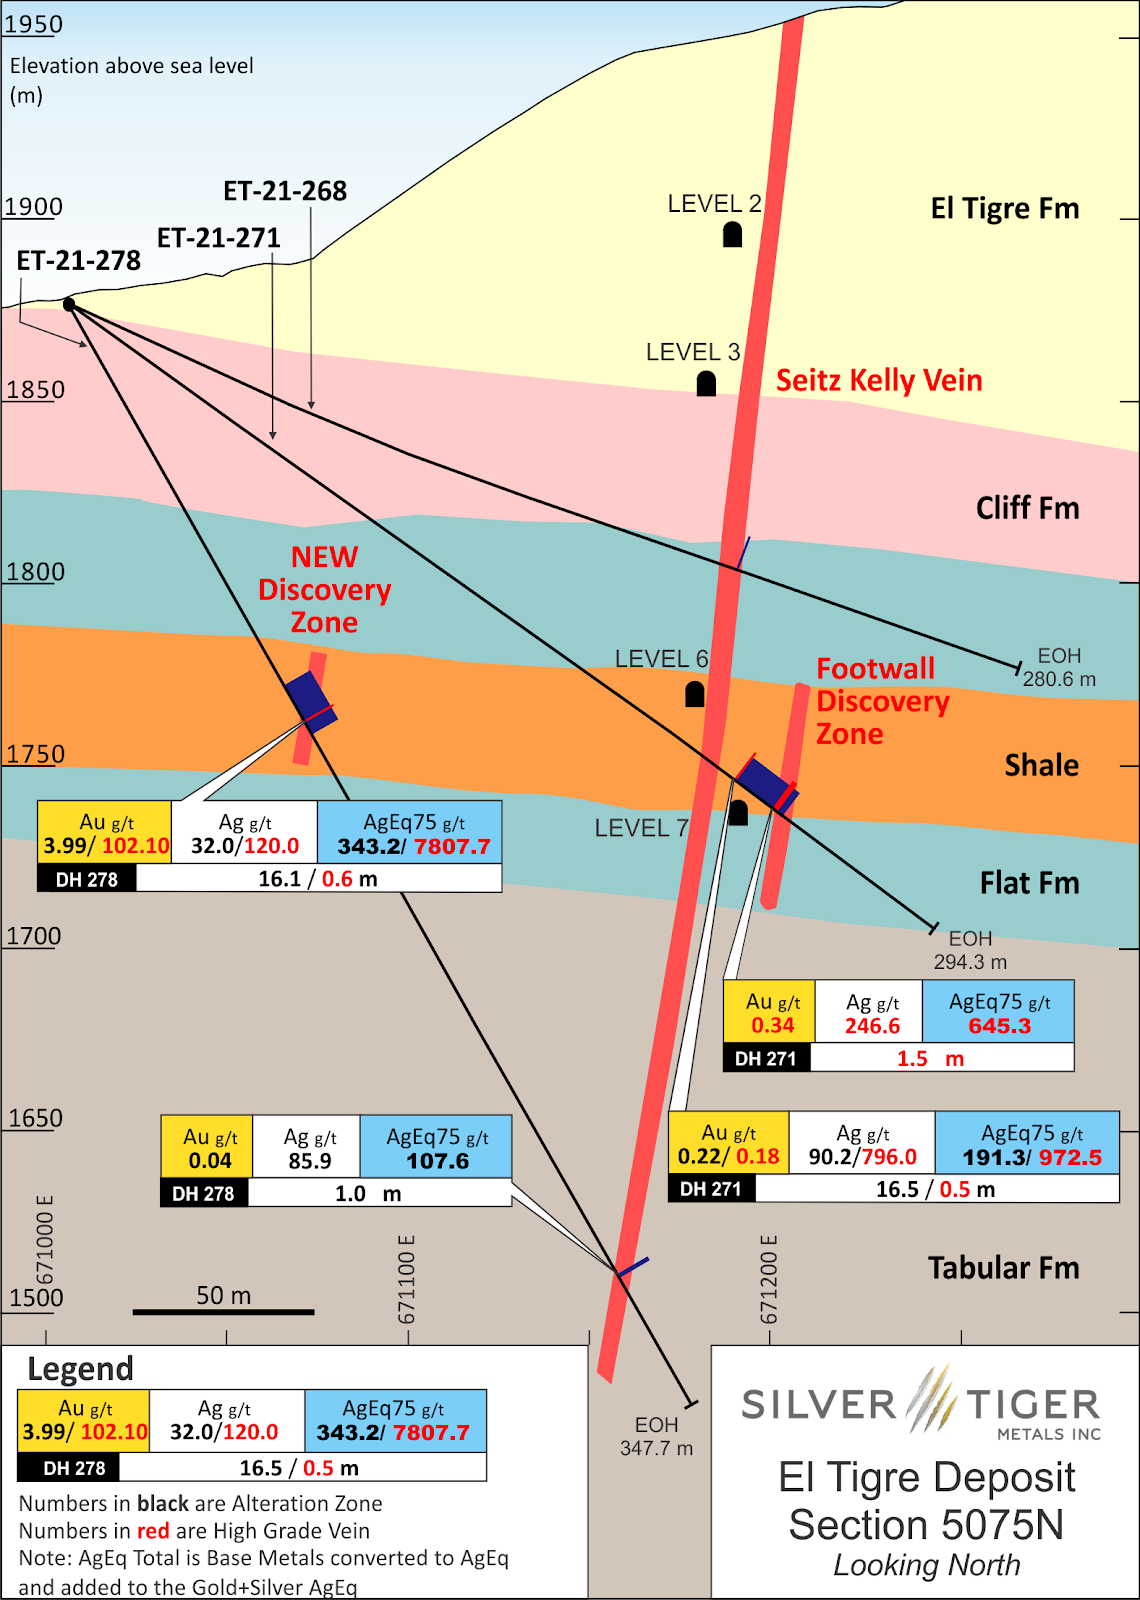
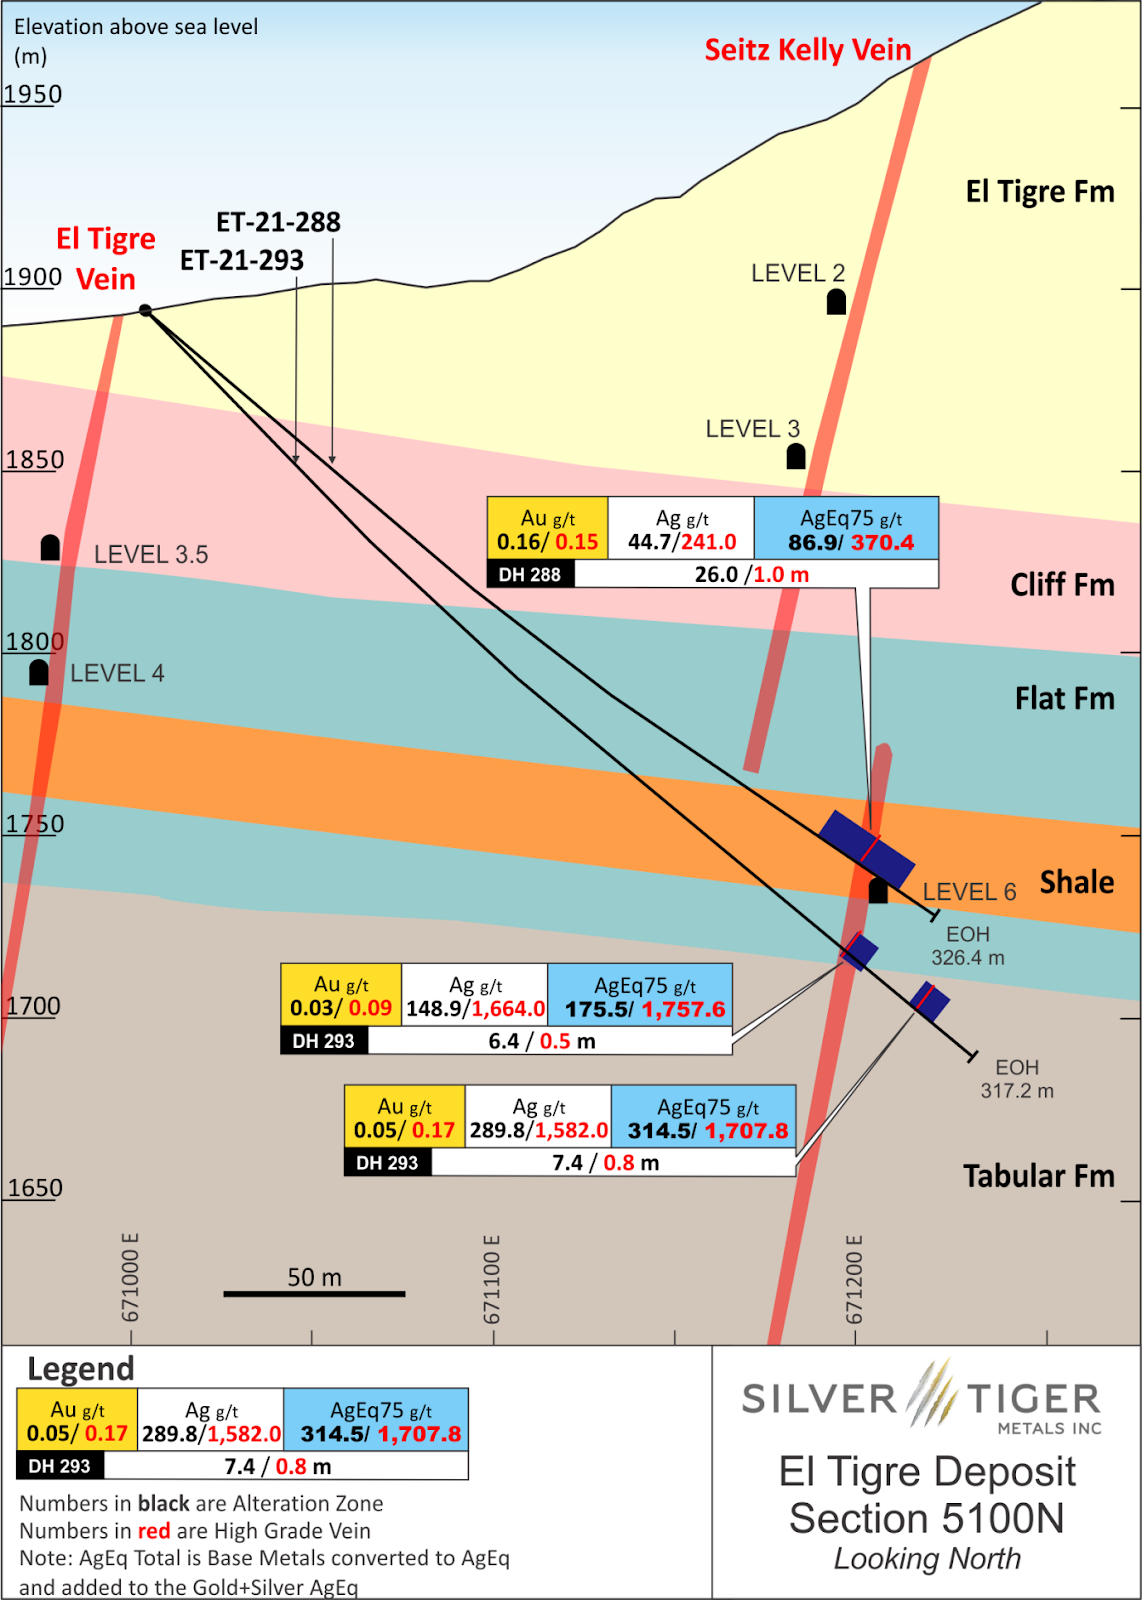
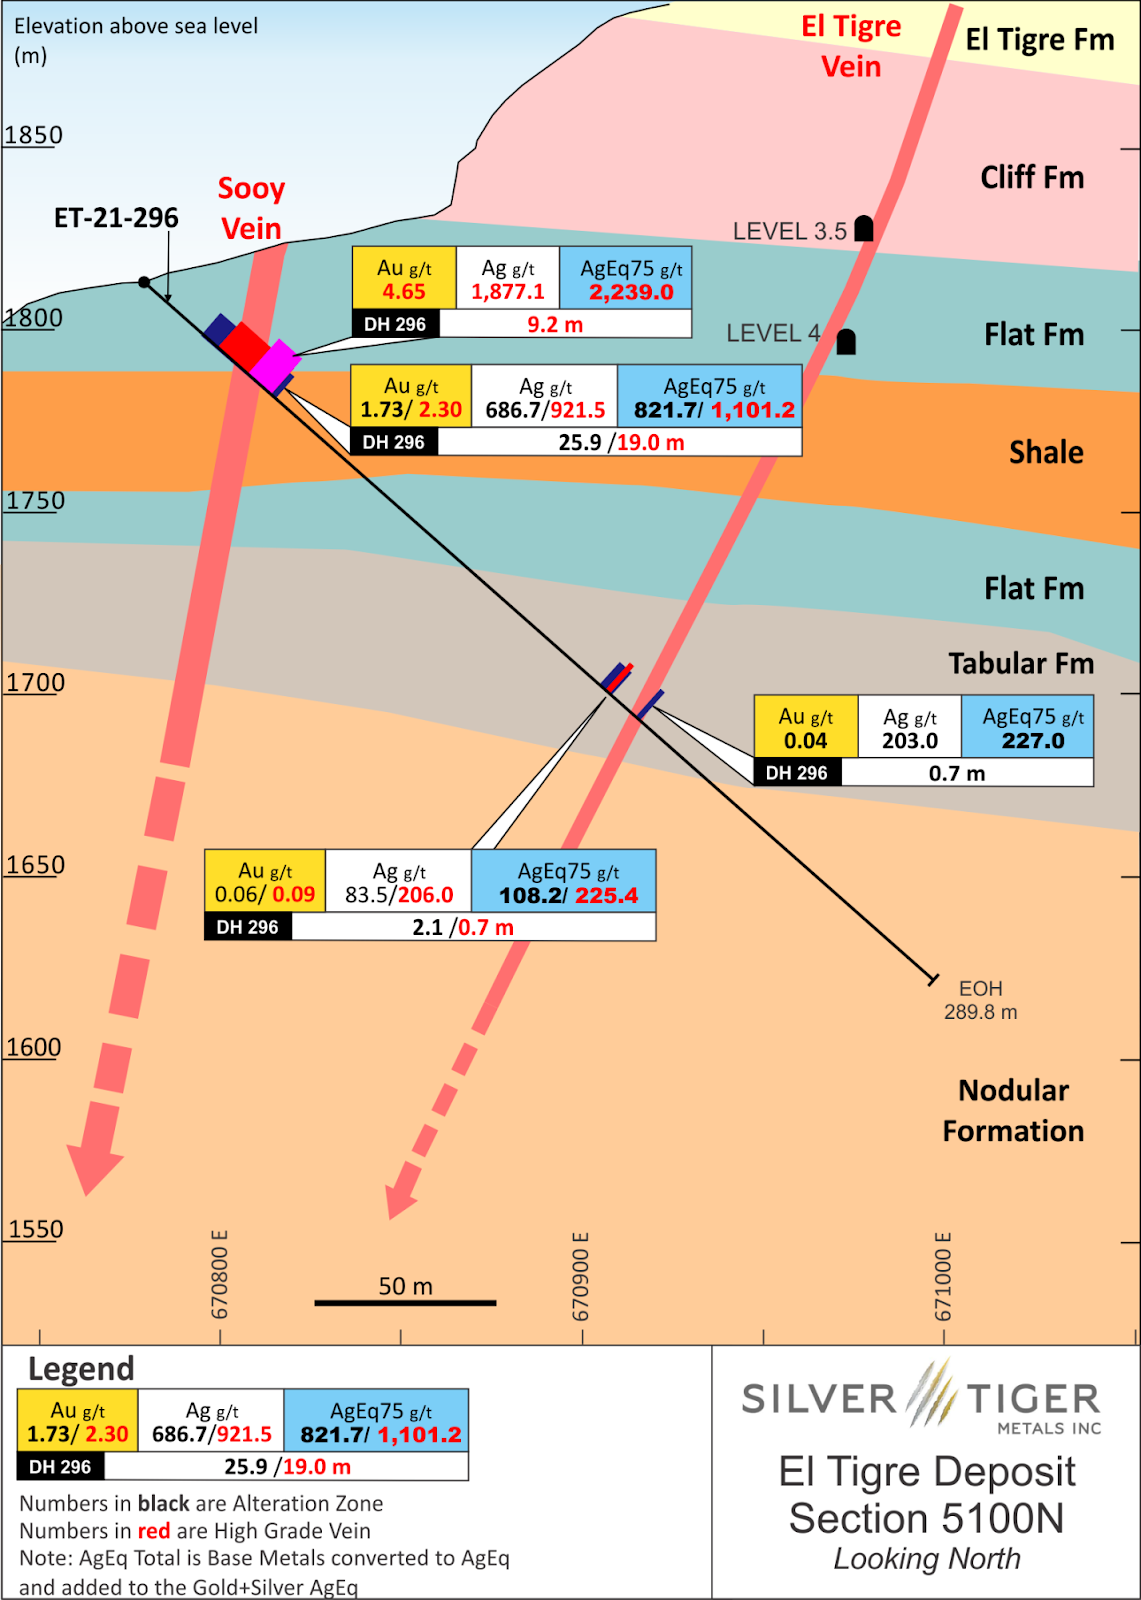
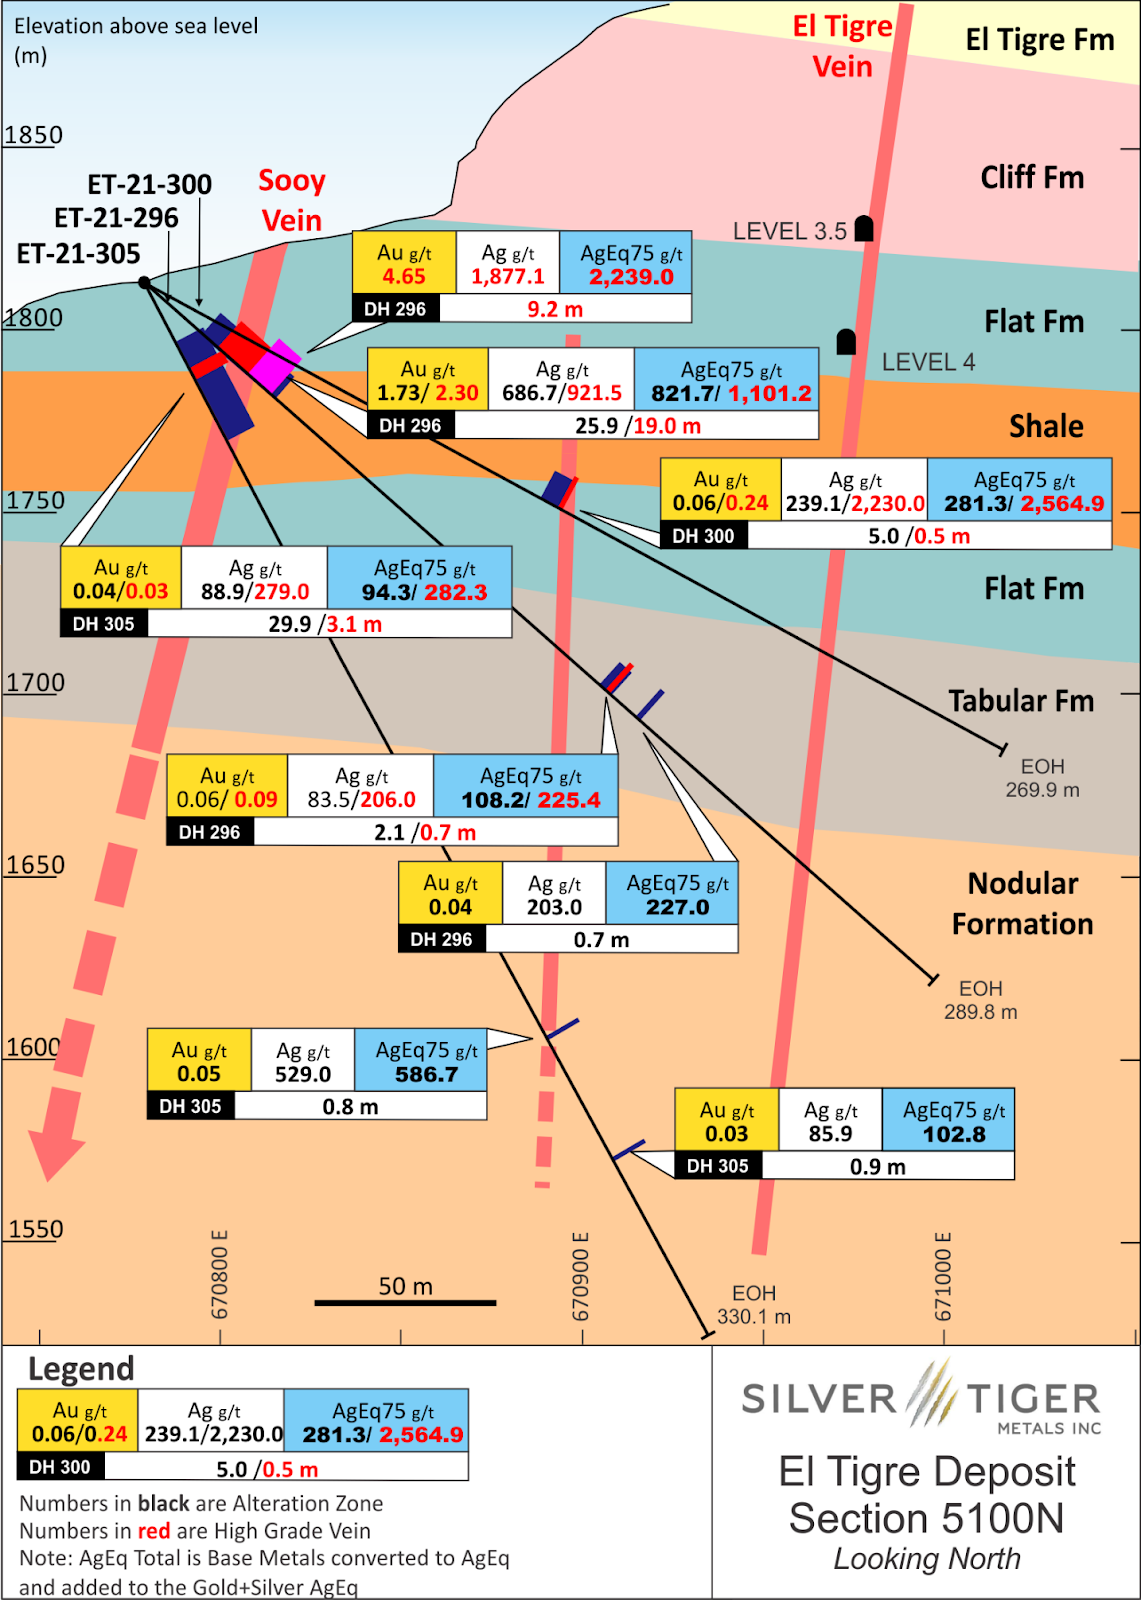
El Tigre Deposit – Conceptual Section Mineralization Styles – Looking North
Unless otherwise herein, Dave Duncan P. Geo, VP Exploration of Silver Tiger is the Qualified Persons as defined under National Instrument 43-101. Mr. Duncan has reviewed and approved the scientific and technical information.
| Area | Vein | Class | Cut-off | Tonnes | Au | Au | Ag | Ag | AuEq | AuEq | AgEq | AgEq | Cu | Cu | Pb | Pb | Zn | Zn |
|---|---|---|---|---|---|---|---|---|---|---|---|---|---|---|---|---|---|---|
| AuEq (g/t) | (k) | (g/t) | (k oz) | (g/t) | (k oz) | (g/t) | (k oz) | (g/t) | (k oz) | (%) | (Mlb) | (%) | (Mlb) | (%) | (Mlb) | |||
| Pit Constrained | Indicated | 0.14 | 43,002 | 0.39 | 535.3 | 14.5 | 20,049 | 0.59 | 818.4 | 44.4 | 61,381 | 0.00 | 1.8 | 0.01 | 7.0 | 0.02 | 14.3 | |
| Inferred | 0.14 | 11,524 | 0.47 | 175.9 | 17.3 | 6,396 | 0.72 | 267.3 | 54.1 | 20,045 | 0.00 | 0.8 | 0.01 | 3.7 | 0.02 | 4.3 | ||
| Out-of-pit | Indicated | 1.5 | 2,323 | 0.38 | 28.7 | 190.5 | 14,231 | 3.72 | 277.8 | 279.0 | 20,838 | 0.15 | 7.6 | 0.55 | 28.0 | 0.97 | 49.8 | |
| Inferred | 1.5 | 9,229 | 0.66 | 196.6 | 154.6 | 45,885 | 3.14 | 930.7 | 235.2 | 69,801 | 0.09 | 17.3 | 0.27 | 55.9 | 0.49 | 99.0 | ||
| Vein Total | Indicated | 0.14+1.5 | 45,325 | 0.39 | 564.0 | 23.5 | 34,279 | 0.75 | 1096.3 | 56.4 | 82,219 | 0.01 | 9.4 | 0.04 | 35.0 | 0.06 | 64.1 | |
| Inferred | 0.14+1.5 | 20,753 | 0.56 | 372.6 | 78.4 | 52,282 | 1.80 | 1198.0 | 134.7 | 89,847 | 0.04 | 18.1 | 0.13 | 59.6 | 0.23 | 103.4 | ||
| Low Grade Stockpiles | Indicated | 0.3 | 103 | 0.90 | 3.0 | 177.4 | 588 | 3.41 | 11.3 | 255.7 | 847 | 0.02 | 0.1 | 0.22 | 0.5 | 0.10 | 0.2 | |
| Inferred | 0.3 | 18 | 0.46 | 0.3 | 145.9 | 83 | 2.52 | 1.4 | 188.8 | 108 | 0.02 | 0.0 | 0.17 | 0.1 | 0.09 | 0.0 | ||
| Tailings | Indicated | 0.3 | 939 | 0.27 | 8.0 | 78.0 | 2,345 | 1.30 | 39.3 | 97.5 | 2,948 | |||||||
| Inferred | 0.3 | 101 | 0.27 | 0.9 | 79.0 | 254 | 1.31 | 4.3 | 98.3 | 323 | ||||||||
| Total (Vein+Stockpile+Tailing) | Indicated | 0.14+1.5+0.3 | 46,367 | 0.39 | 575.0 | 25.0 | 37,212 | 0.77 | 1146.9 | 57.7 | 86,014 | 0.01 | 9.4 | 0.03 | 35.5 | 0.06 | 64.3 | |
| Inferred | 0.14+1.5+0.3 | 20,871 | 0.56 | 373.7 | 78.4 | 52,619 | 1.79 | 1203.7 | 134.5 | 90,277 | 0.04 | 18.1 | 0.13 | 59.7 | 0.22 | 103.4 | ||
| Classification | Cut-off | Tonnes | Au | Au | Ag | Ag | AuEq | AuEq | AgEq | AgEq | Cu | Pb | Zn |
|---|---|---|---|---|---|---|---|---|---|---|---|---|---|
| AuEq (g/t) | (k) | (g/t) | (k oz) | (g/t) | (k oz) | (g/t) | (k oz) | (g/t) | (k oz) | (%) | (%) | (%) | |
| Indicated | 1 | 5,719 | 0.94 | 172.4 | 56.9 | 10,464 | 1.72 | 315.6 | 128.7 | 23,672 | 0.00 | 0.02 | 0.02 |
| 0.9 | 6,874 | 0.89 | 196.3 | 51.0 | 11,273 | 1.59 | 350.8 | 119.0 | 26,310 | 0.00 | 0.01 | 0.02 | |
| 0.8 | 8,326 | 0.83 | 223.1 | 45.5 | 12,177 | 1.46 | 390.3 | 109.4 | 29,273 | 0.00 | 0.01 | 0.02 | |
| 0.7 | 10,251 | 0.77 | 255.4 | 39.9 | 13,166 | 1.32 | 436.5 | 99.3 | 32,739 | 0.00 | 0.01 | 0.02 | |
| 0.6 | 12,971 | 0.71 | 295.4 | 34.3 | 14,323 | 1.18 | 493.0 | 88.7 | 36,976 | 0.00 | 0.01 | 0.02 | |
| 0.5 | 16,816 | 0.64 | 344.4 | 28.9 | 15,615 | 1.04 | 560.6 | 77.8 | 42,045 | 0.00 | 0.01 | 0.02 | |
| 0.4 | 22,280 | 0.56 | 402.8 | 23.7 | 16,979 | 0.89 | 639.1 | 66.9 | 47,929 | 0.00 | 0.01 | 0.02 | |
| 0.3 | 29,999 | 0.48 | 466.1 | 19.2 | 18,488 | 0.75 | 724.9 | 56.4 | 54,368 | 0.00 | 0.01 | 0.02 | |
| 0.2 | 38,688 | 0.42 | 518.1 | 15.8 | 19,659 | 0.64 | 794.9 | 47.9 | 59,618 | 0.00 | 0.01 | 0.02 | |
| 0.14 | 43,002 | 0.39 | 535.3 | 14.5 | 20,049 | 0.59 | 818.4 | 44.4 | 61,381 | 0.00 | 0.01 | 0.02 | |
| 0.1 | 45,774 | 0.37 | 543.1 | 13.7 | 20,215 | 0.56 | 829.1 | 42.3 | 62,183 | 0.00 | 0.01 | 0.01 | |
| Inferred | 1 | 2,617 | 1.06 | 89.5 | 47.1 | 3,962 | 1.72 | 144.8 | 129.1 | 10,862 | 0.01 | 0.04 | 0.02 |
| 0.9 | 2,811 | 1.03 | 92.7 | 46.0 | 4,158 | 1.67 | 150.7 | 125.1 | 11,306 | 0.01 | 0.04 | 0.02 | |
| 0.8 | 3,115 | 0.98 | 97.7 | 43.9 | 4,394 | 1.59 | 159.0 | 119.1 | 11,926 | 0.01 | 0.04 | 0.02 | |
| 0.7 | 3,704 | 0.90 | 107.1 | 39.7 | 4,724 | 1.45 | 173.1 | 109.0 | 12,985 | 0.01 | 0.03 | 0.02 | |
| 0.6 | 4,562 | 0.82 | 119.7 | 34.7 | 5,095 | 1.30 | 191.0 | 97.7 | 14,329 | 0.01 | 0.03 | 0.02 | |
| 0.5 | 5,404 | 0.75 | 130.5 | 30.9 | 5,371 | 1.19 | 205.9 | 88.9 | 15,443 | 0.00 | 0.02 | 0.02 | |
| 0.4 | 6,631 | 0.67 | 143.7 | 26.6 | 5,662 | 1.05 | 223.5 | 78.6 | 16,762 | 0.00 | 0.02 | 0.02 | |
| 0.3 | 8,603 | 0.58 | 160.4 | 21.7 | 5,999 | 0.89 | 245.5 | 66.6 | 18,413 | 0.00 | 0.02 | 0.02 | |
| 0.2 | 10,725 | 0.50 | 172.7 | 18.3 | 6,324 | 0.76 | 262.9 | 57.2 | 19,715 | 0.00 | 0.02 | 0.02 | |
| 0.14 | 11,524 | 0.47 | 175.9 | 17.3 | 6,396 | 0.72 | 267.3 | 54.1 | 20,045 | 0.00 | 0.01 | 0.02 | |
| 0.1 | 11,796 | 0.47 | 176.7 | 16.9 | 6,415 | 0.71 | 268.3 | 53.1 | 20,124 | 0.00 | 0.01 | 0.02 |
| Classification | Cut-off | Tonnes | Au | Au | Ag | Ag | AuEq | AuEq | AgEq | AgEq | Cu | Pb | Zn |
|---|---|---|---|---|---|---|---|---|---|---|---|---|---|
| AuEq (g/t) | (k) | (g/t) | (k oz) | (g/t) | (k oz) | (g/t) | (k oz) | (g/t) | (k oz) | (%) | (%) | (%) | |
| Indicated | 5 | 469 | 0.73 | 11.0 | 418.2 | 6,309 | 8.19 | 123.5 | 614.1 | 9,263 | 0.39 | 1.24 | 2.21 |
| 4.5 | 557 | 0.68 | 12.3 | 390.6 | 7,000 | 7.64 | 136.9 | 573.1 | 10,269 | 0.36 | 1.15 | 2.08 | |
| 4 | 669 | 0.64 | 13.8 | 362.0 | 7,781 | 7.08 | 152.1 | 530.7 | 11,406 | 0.33 | 1.06 | 1.93 | |
| 3.5 | 821 | 0.59 | 15.7 | 330.9 | 8,740 | 6.45 | 170.5 | 484.0 | 12,784 | 0.29 | 0.96 | 1.74 | |
| 3 | 1,021 | 0.54 | 17.8 | 299.2 | 9,820 | 5.82 | 191.2 | 436.9 | 14,338 | 0.25 | 0.87 | 1.56 | |
| 2.5 | 1,274 | 0.50 | 20.4 | 267.5 | 10,954 | 5.21 | 213.4 | 390.9 | 16,009 | 0.22 | 0.77 | 1.40 | |
| 2 | 1,665 | 0.44 | 23.8 | 231.5 | 12,396 | 4.51 | 241.6 | 338.4 | 18,118 | 0.19 | 0.67 | 1.20 | |
| 1.5 | 2,323 | 0.38 | 28.7 | 190.5 | 14,231 | 3.72 | 277.8 | 279.0 | 20,838 | 0.15 | 0.55 | 0.97 | |
| 1 | 3,725 | 0.34 | 40.2 | 139.9 | 16,758 | 2.78 | 332.7 | 208.3 | 24,951 | 0.11 | 0.40 | 0.70 | |
| Inferred | 5 | 1,149 | 1.24 | 45.8 | 362.7 | 13,395 | 6.68 | 246.6 | 500.8 | 18,495 | 0.15 | 0.38 | 0.65 |
| 4.5 | 1,598 | 1.04 | 53.6 | 339.5 | 17,442 | 6.15 | 315.9 | 461.1 | 23,689 | 0.14 | 0.38 | 0.64 | |
| 4 | 1,919 | 1.02 | 63.2 | 318.2 | 19,637 | 5.83 | 359.6 | 437.0 | 26,968 | 0.13 | 0.38 | 0.62 | |
| 3.5 | 2,520 | 0.98 | 79.8 | 287.9 | 23,327 | 5.33 | 432.0 | 399.9 | 32,399 | 0.11 | 0.35 | 0.58 | |
| 3 | 3,898 | 0.80 | 100.4 | 243.5 | 30,521 | 4.63 | 579.7 | 346.9 | 43,478 | 0.11 | 0.38 | 0.70 | |
| 2.5 | 4,912 | 0.84 | 132.3 | 216.8 | 34,240 | 4.24 | 669.0 | 317.7 | 50,174 | 0.10 | 0.33 | 0.62 | |
| 2 | 6,253 | 0.78 | 157.1 | 192.8 | 38,763 | 3.81 | 765.1 | 285.5 | 57,384 | 0.09 | 0.30 | 0.55 | |
| 1.5 | 9,229 | 0.66 | 196.6 | 154.6 | 45,885 | 3.14 | 930.7 | 235.2 | 69,801 | 0.09 | 0.27 | 0.49 | |
| 1 | 15,187 | 0.54 | 261.6 | 115.4 | 56,339 | 2.39 | 1166.8 | 179.2 | 87,508 | 0.07 | 0.21 | 0.37 |
Notes:
1. Mineral Resources which are not Mineral Reserves, do not have demonstrated economic viability. The estimate of Mineral Resources may be materially affected by environmental, permitting, legal, title, taxation, socio-political, marketing, or other relevant issues.
2. The Inferred Mineral Resource in this estimate has a lower level of confidence than that applied to an Indicated Mineral Resource and must not be converted to a Mineral Reserve. It is reasonably expected that the majority of the Inferred Mineral Resource could be upgraded to an Indicated Mineral Resource with continued exploration.
3. The Mineral Resources in this news release were estimated in accordance with the Canadian Institute of Mining, Metallurgy and Petroleum (CIM), CIM Standards on Mineral Resources and Reserves, Definitions and Guidelines (2014) prepared by the CIM Standing Committee on Reserve Definitions and adopted by the CIM Council and CIM Best Practices (2019).
Historically mined areas were depleted from the Mineral Resource model.
Approximately 74.7% of the Indicated and 22.3% of the Inferred contained AgEq ounces are pit
constrained, with the remainder out-of-pit. See tables 2 and 3 for details of the split between pit constrained and out-of-pit deposits.
6. The pit constrained AuEq cut-off grade of 0.14 g/t was derived from US$1,800/oz Au price, US$24/oz Ag price, 80% process recovery for Ag and Au, US$5.30/tonne process cost and US$1.00/tonne G&A cost. The constraining pit optimization parameters were $1.86/t mineralized mining cost, $1.86/t waste mining cost and 50-degree pit slopes.
7. The out-of-pit AuEq cut-off grade of 1.5 g/t AuEq was derived from US$1,800/oz Au price, US$24/oz Ag price, $4.00$/lb Cu, $0.95 $/lb Pb, $1.40 $/lb Zn, 85% process recovery for all metals, $50/t mining cost, US$20/tonne process and US$4 G&A cost. The out-of-pit Mineral Resource grade blocks were quantified above the 1.5 g/t AuEq cut-off, below the constraining pit shell within the constraining mineralized wireframes and exhibited sufficient continuity to be considered for cut and fill and long hole mining.
No Mineral Resources are classified as Measured.
AgEq and AuEq calculated at an Ag/Au ratio of 75:1.
Totals may not agree due to rounding
Dave Duncan P. Geo., VP Exploration of Silver Tiger, Charles Spath, P. Geo., VP of Technical Services of Silver Tiger, and Eugene Puritch, P.Eng., FEC, CET, President of P&E Mining Consultants are the Qualified Persons as defined under National Instrument 43-101. Mr. Duncan, Mr. Spath and Mr. Puritch have reviewed and approved the scientific and technical information related to the Mineral Resource Estimate.
The PEA was based on information and data supplied by Silver Tiger, and was undertaken by William J. Lewis, B.Sc., P.Geo., Kerrine Azougarh, B.Sc., P.Eng. and Christopher Jacobs, CEng, MIMMM, MBA of Micon International Limited. Of Toronto, Ontario, and David J. Salari, P. Eng. of D.E.N.M. Engineering Ltd are the Qualified Persons as defined under National Instrument 43-101. All Qualified Persons have reviewed and approved the scientific and technical information related to the Preliminary Economic Assessment.
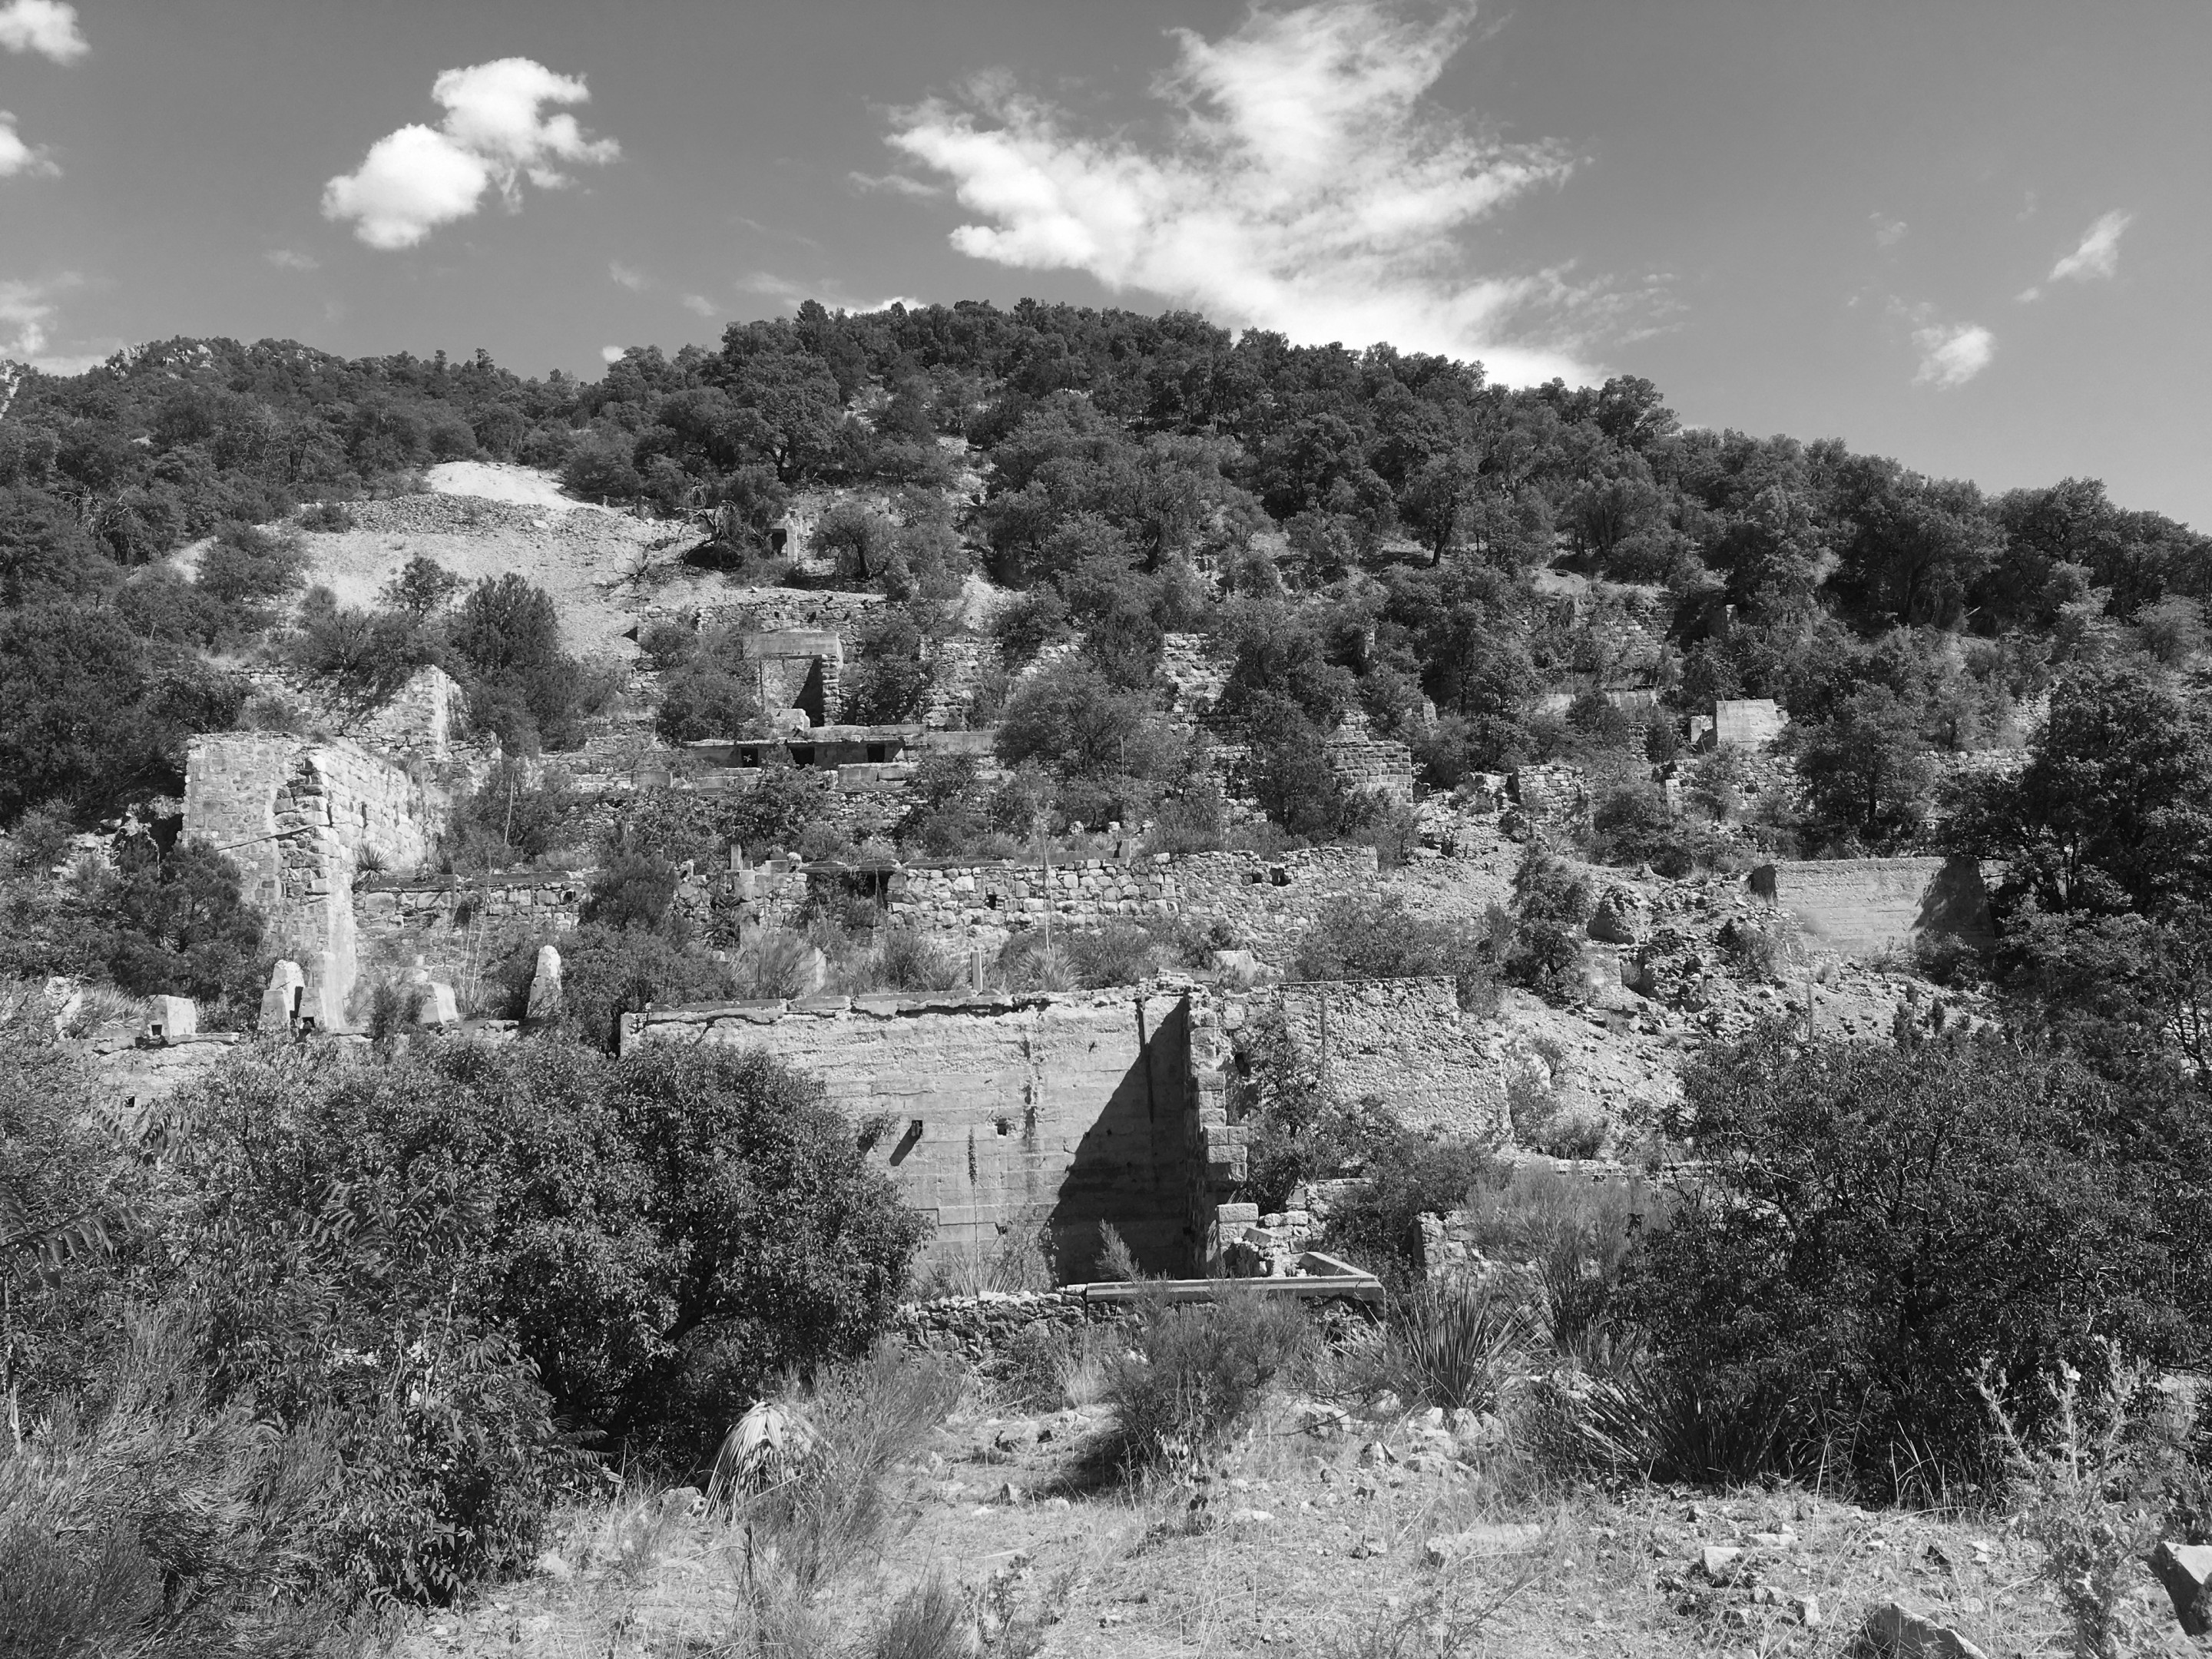
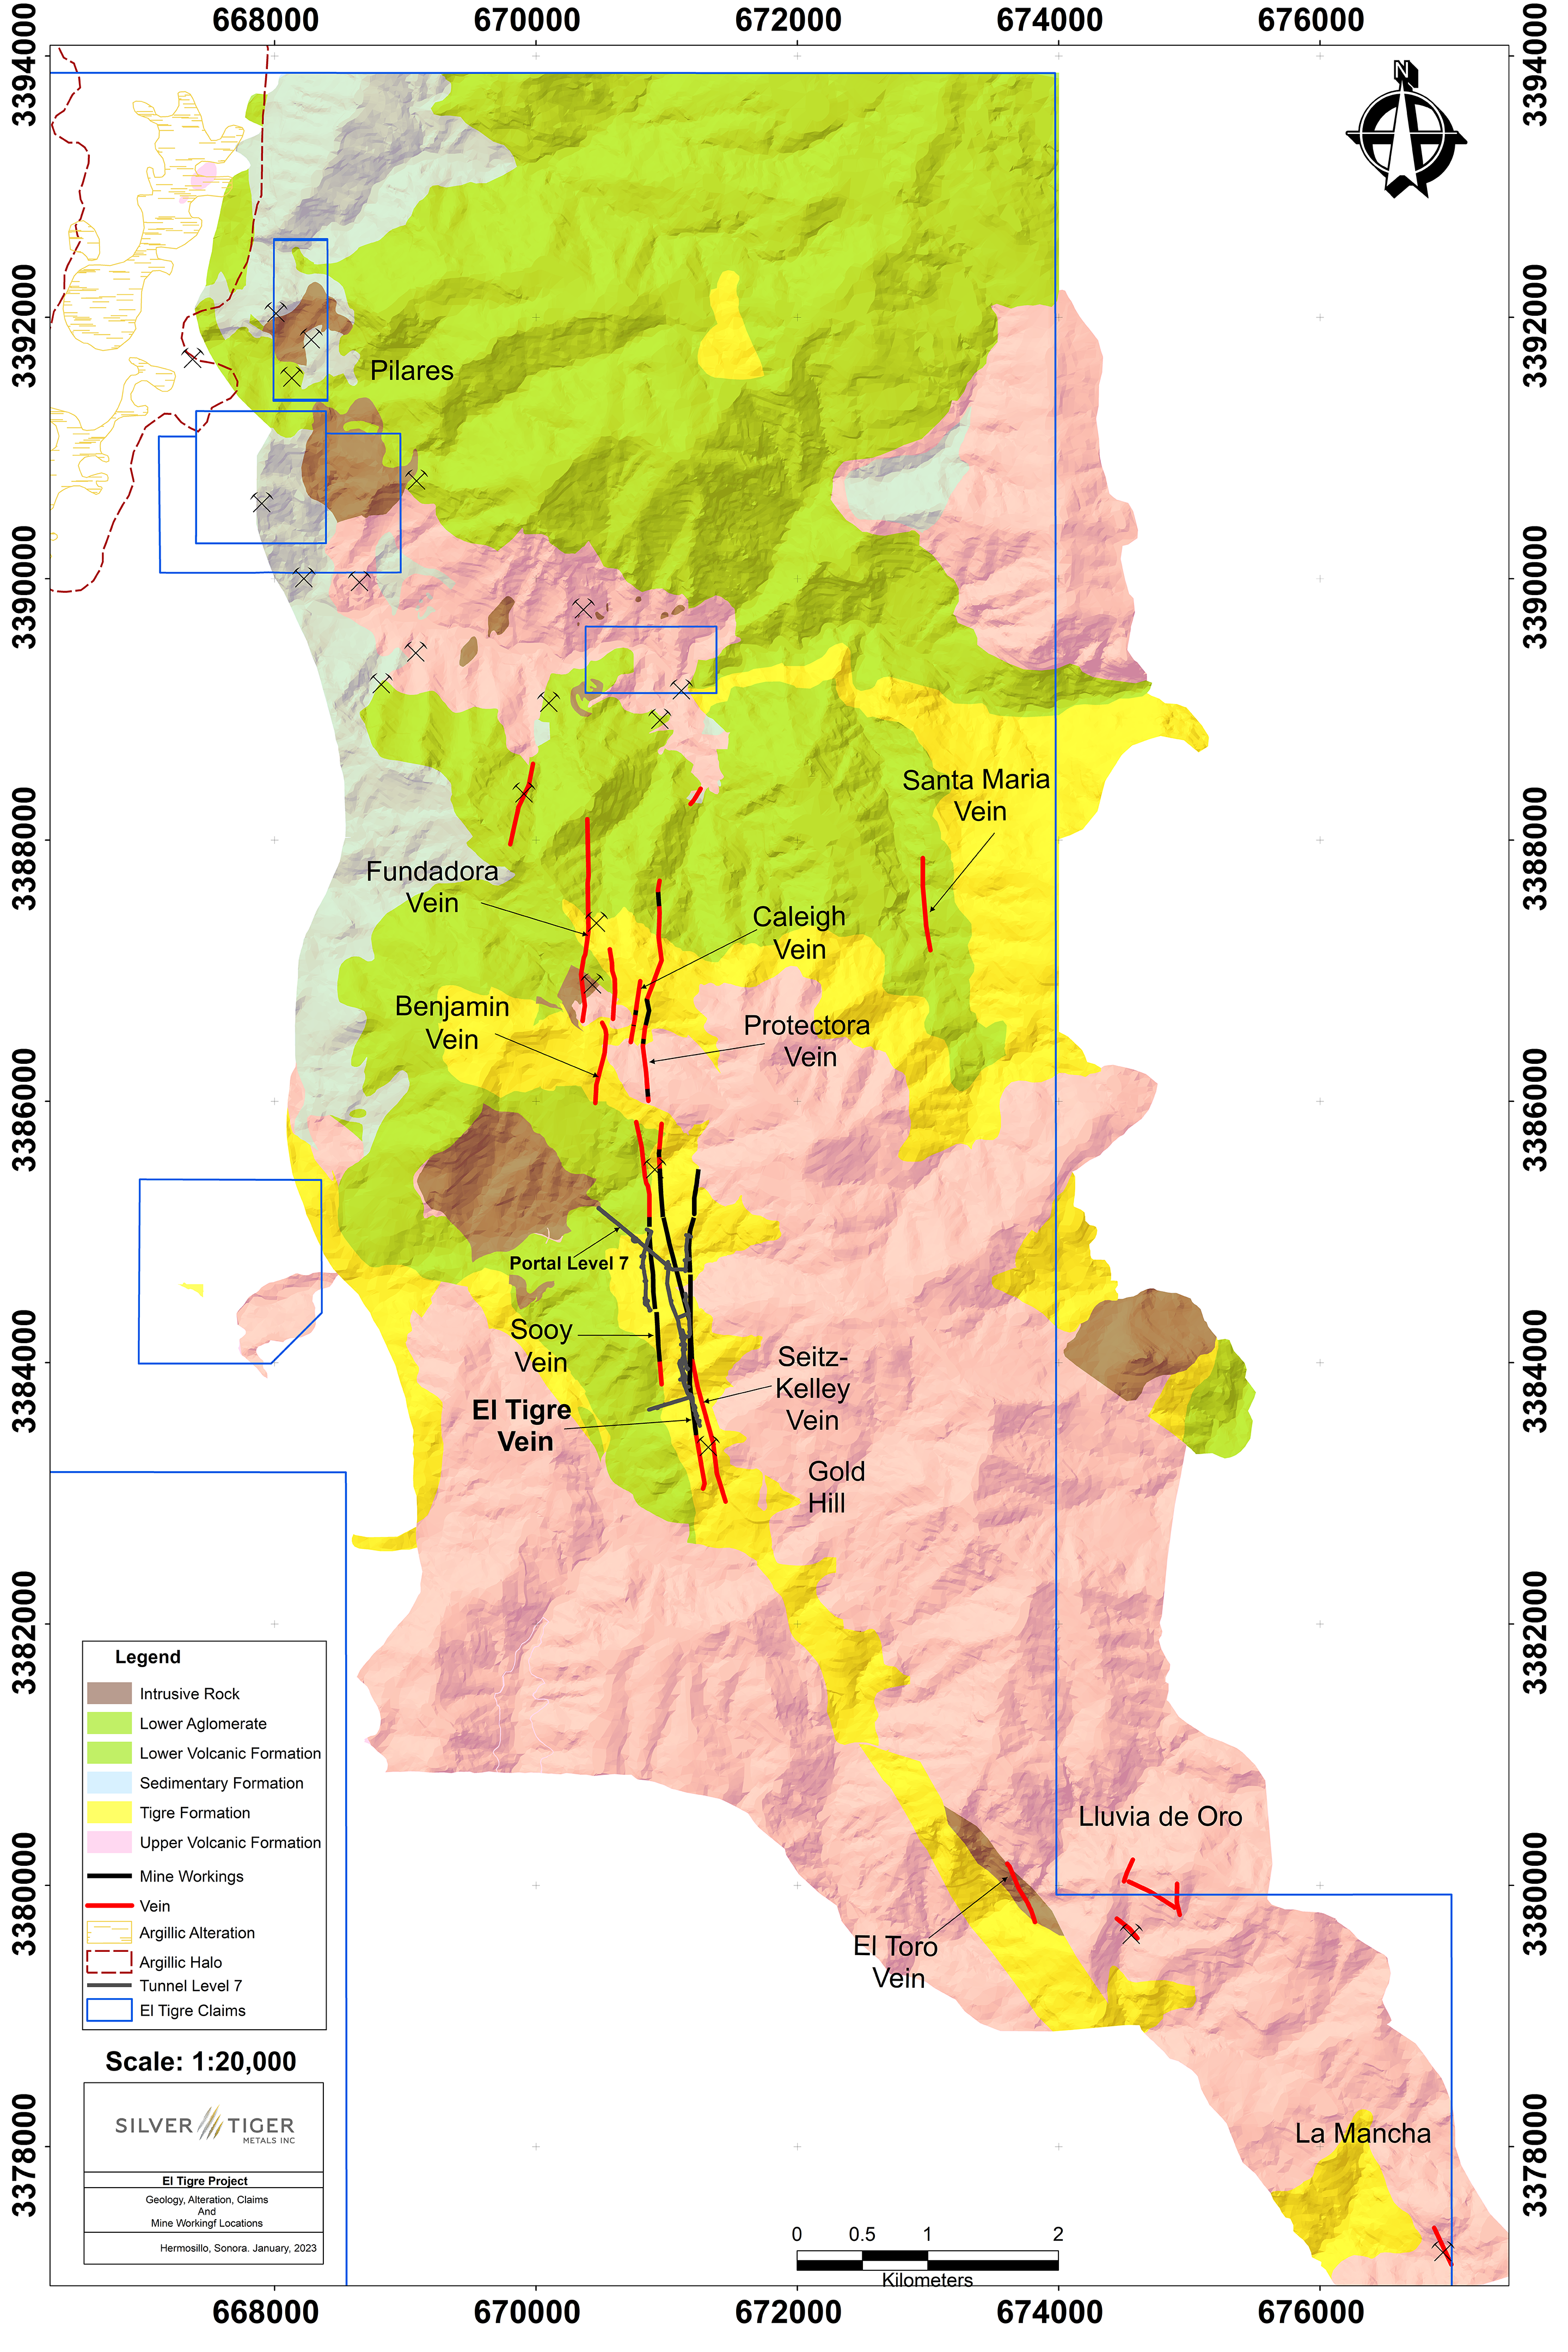
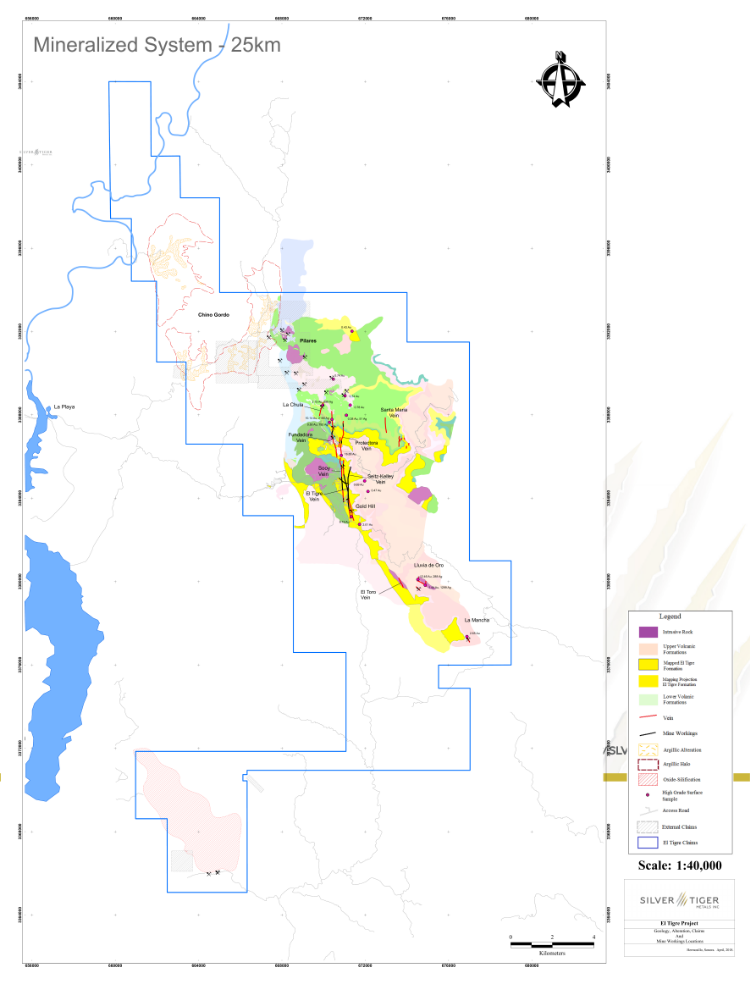
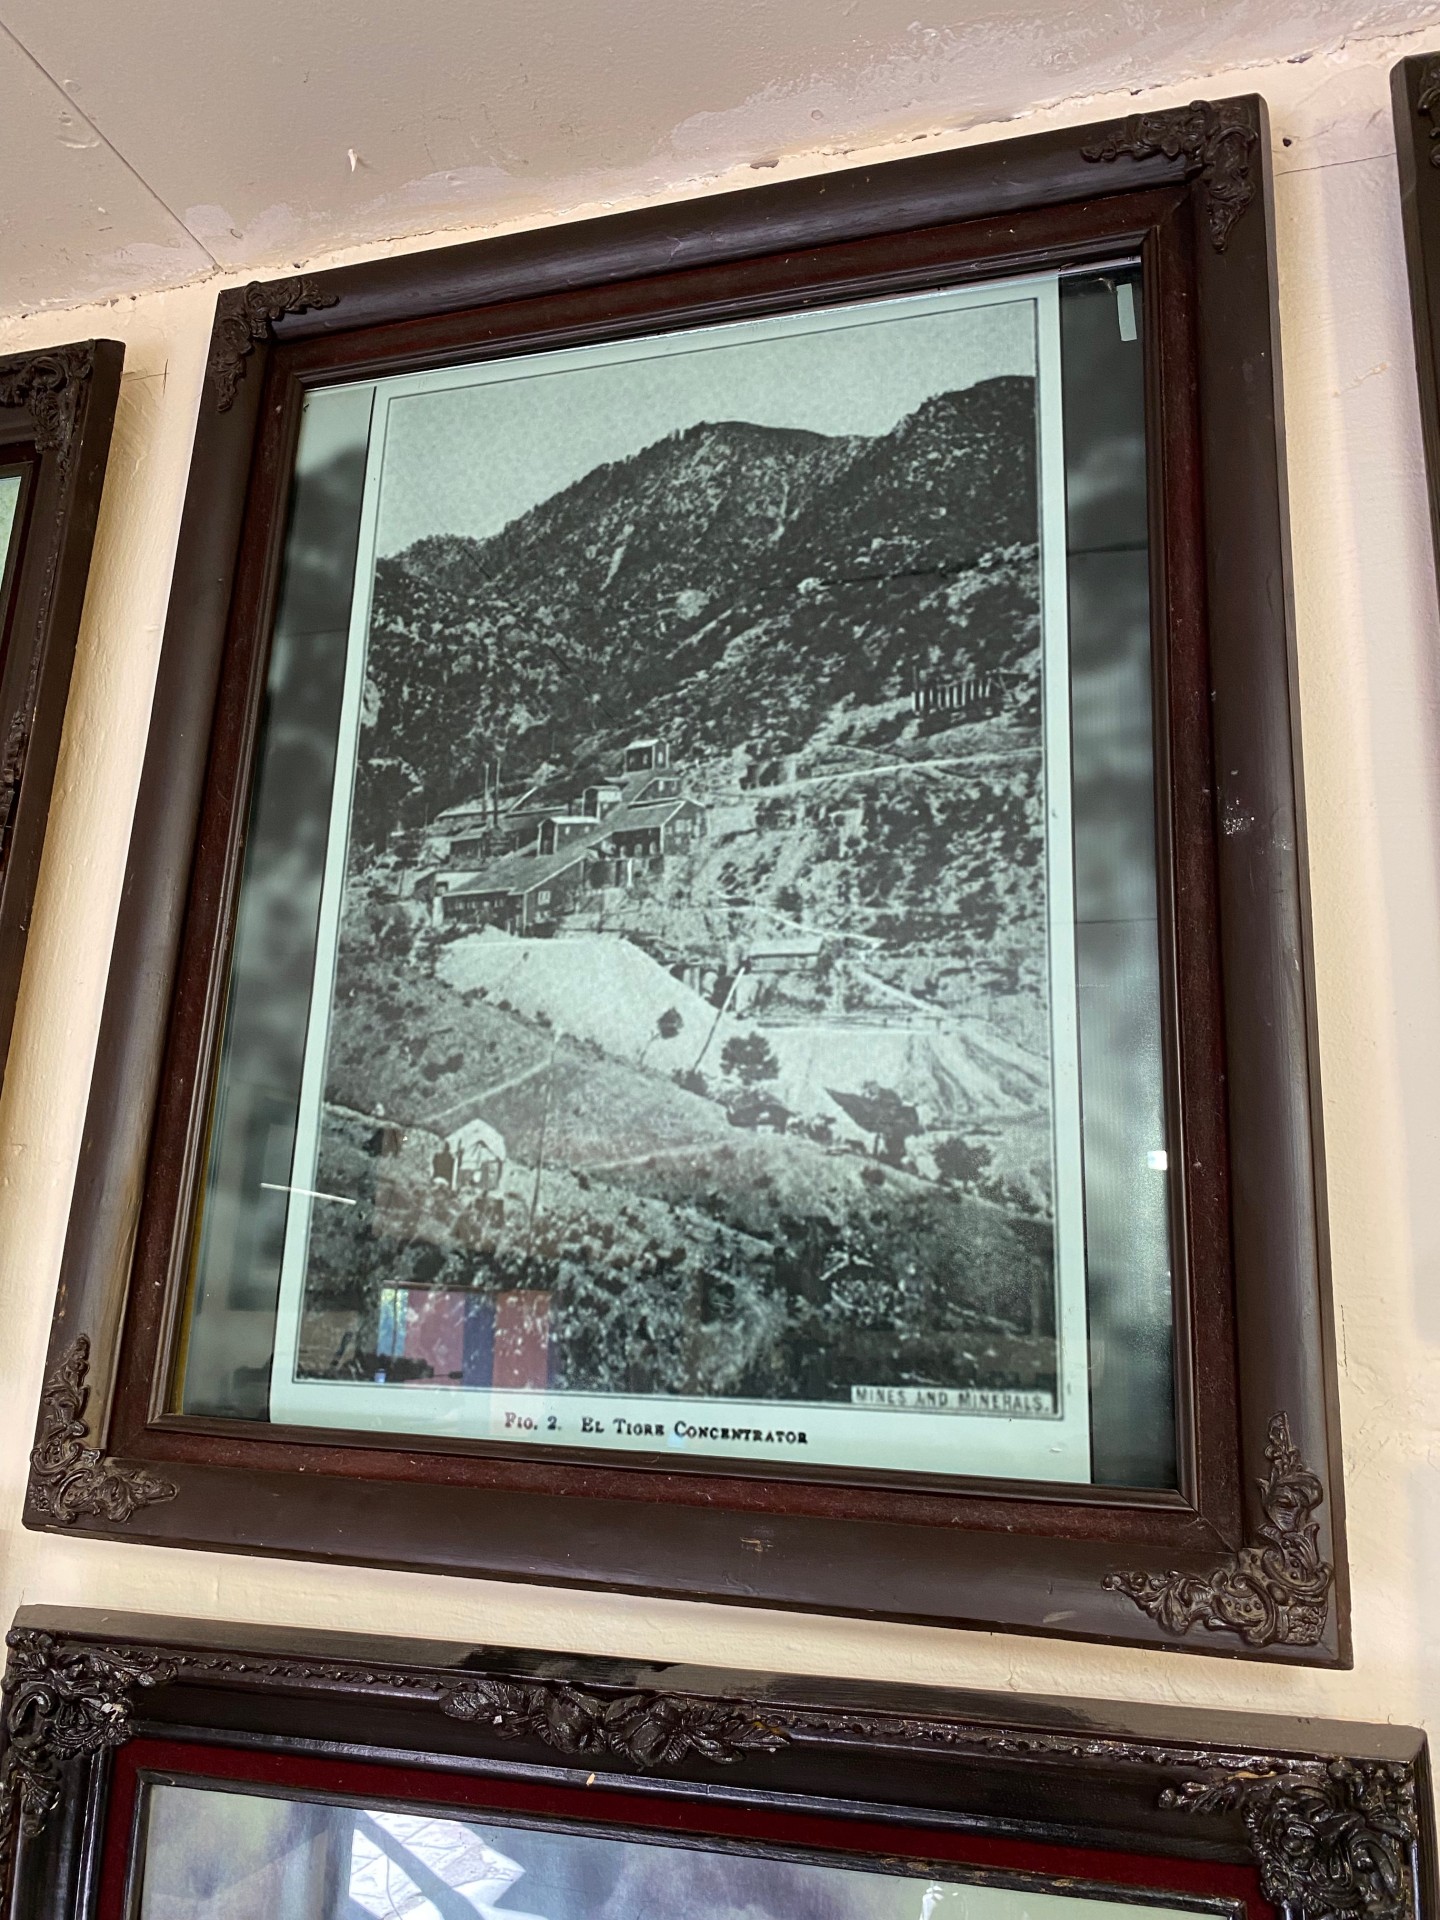
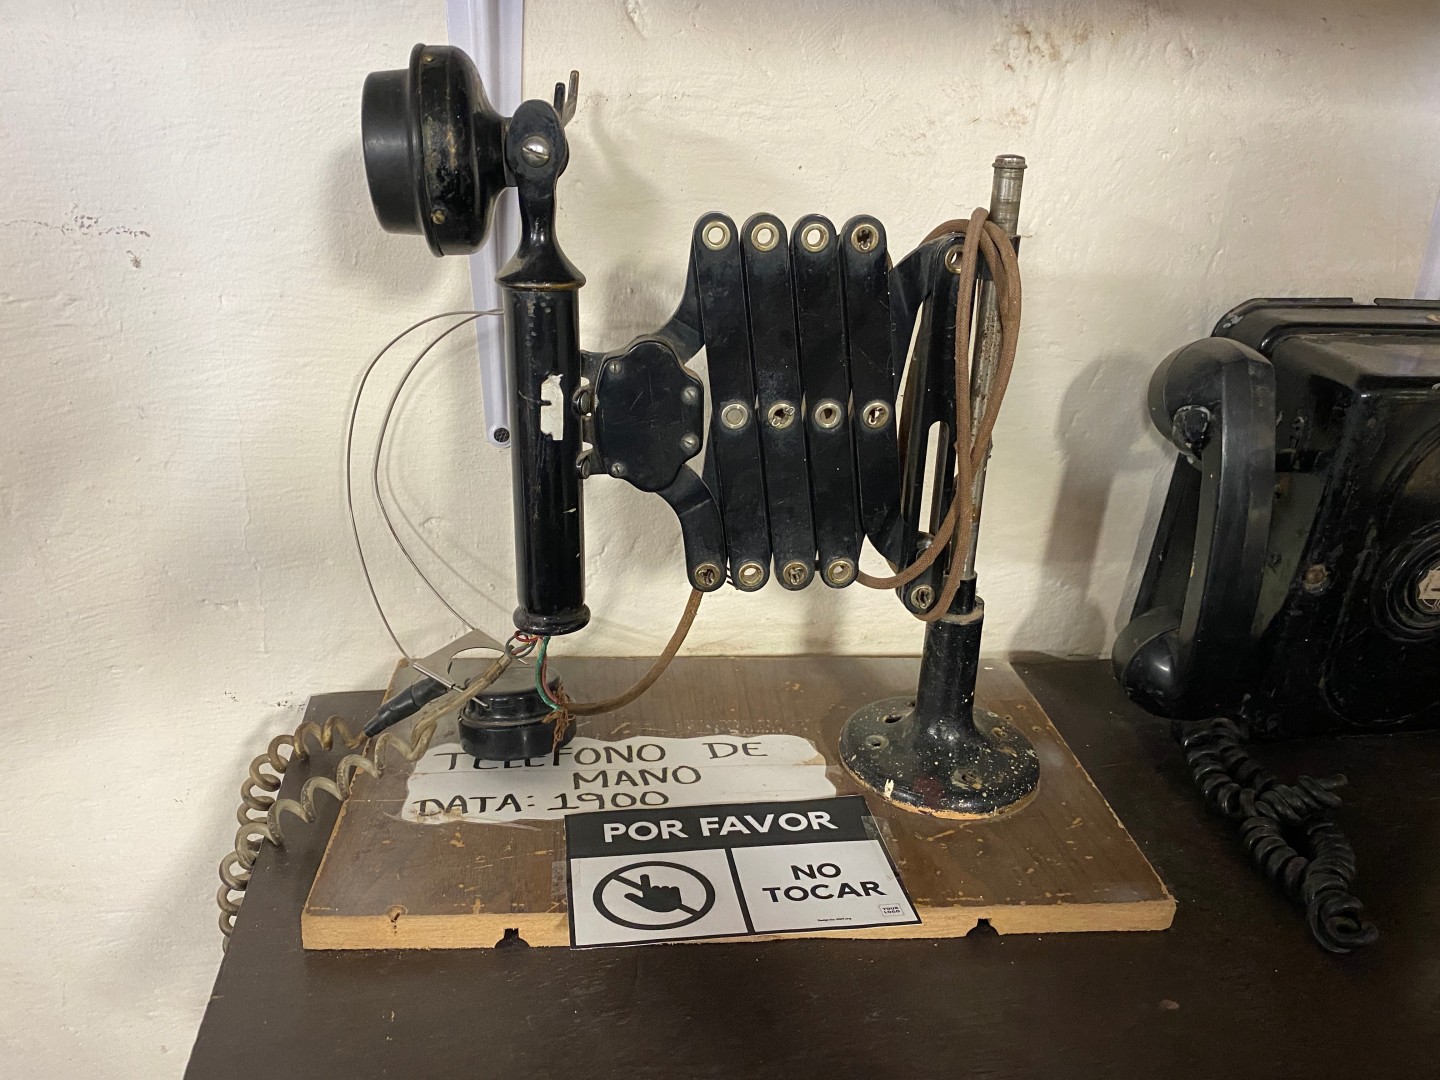
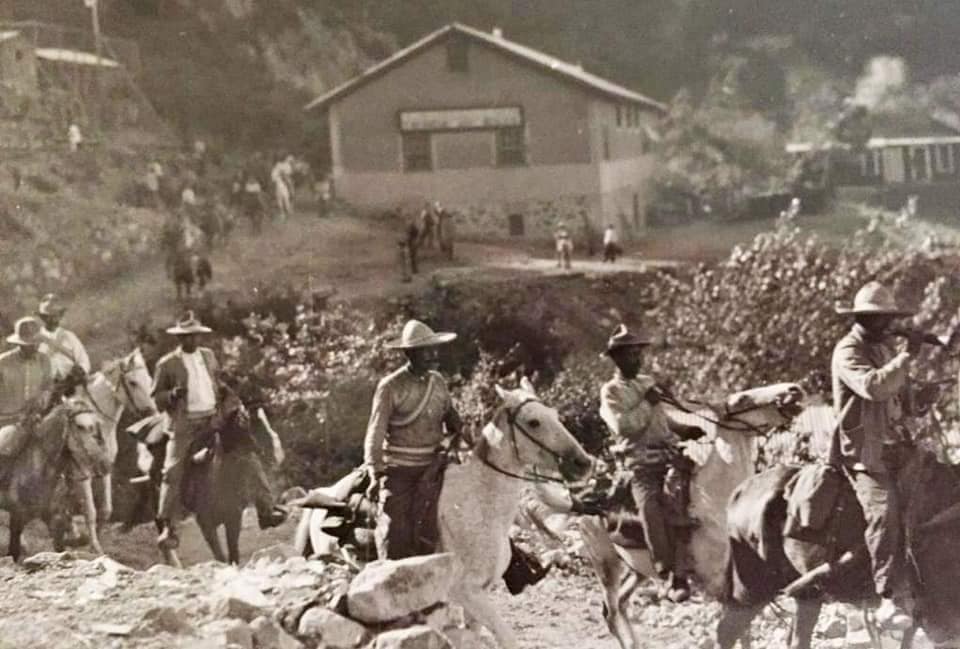
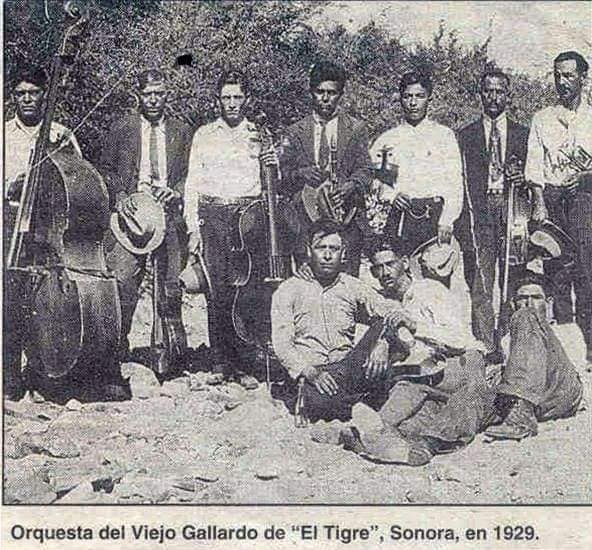
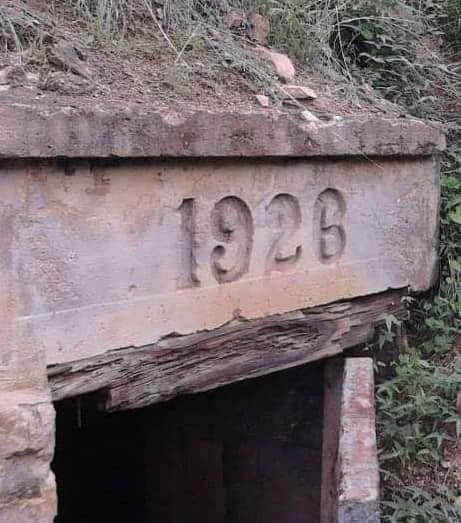
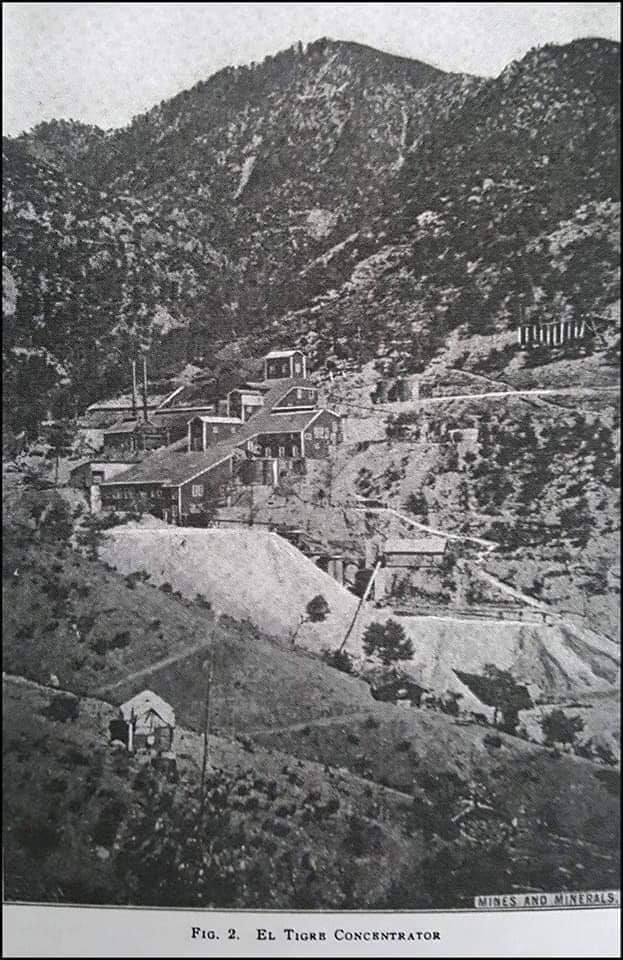
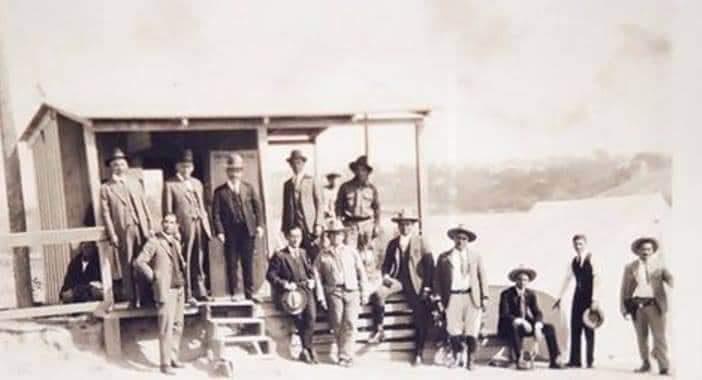
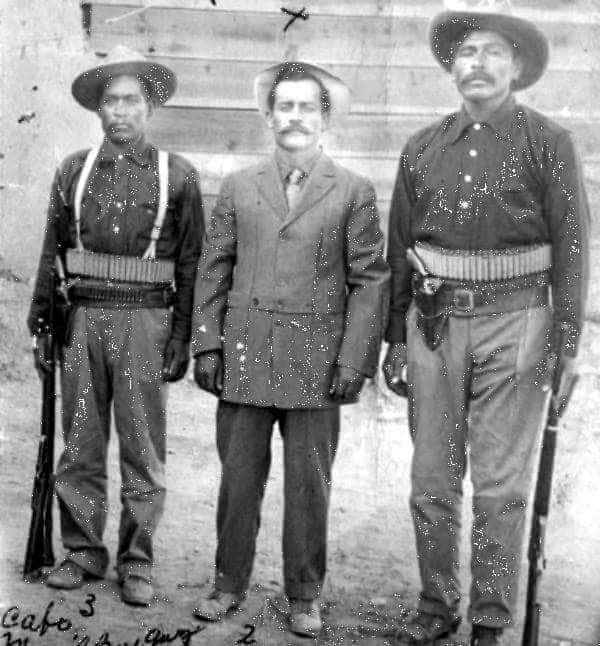
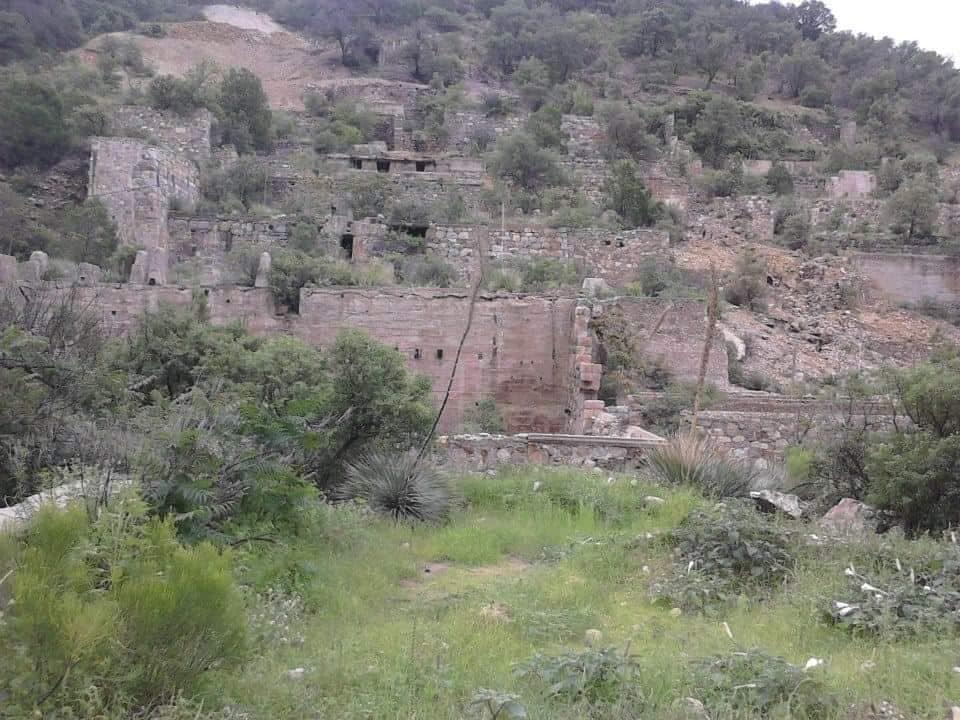
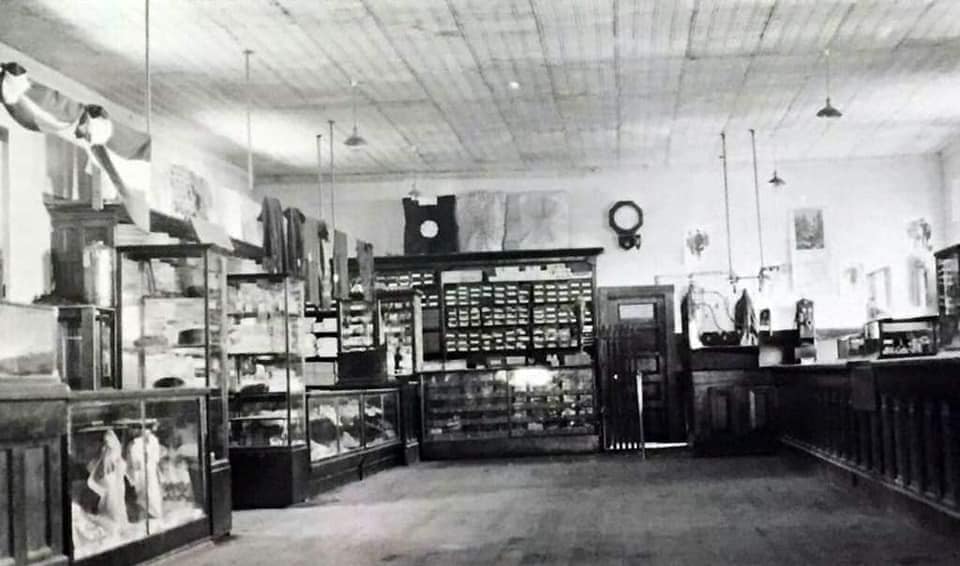
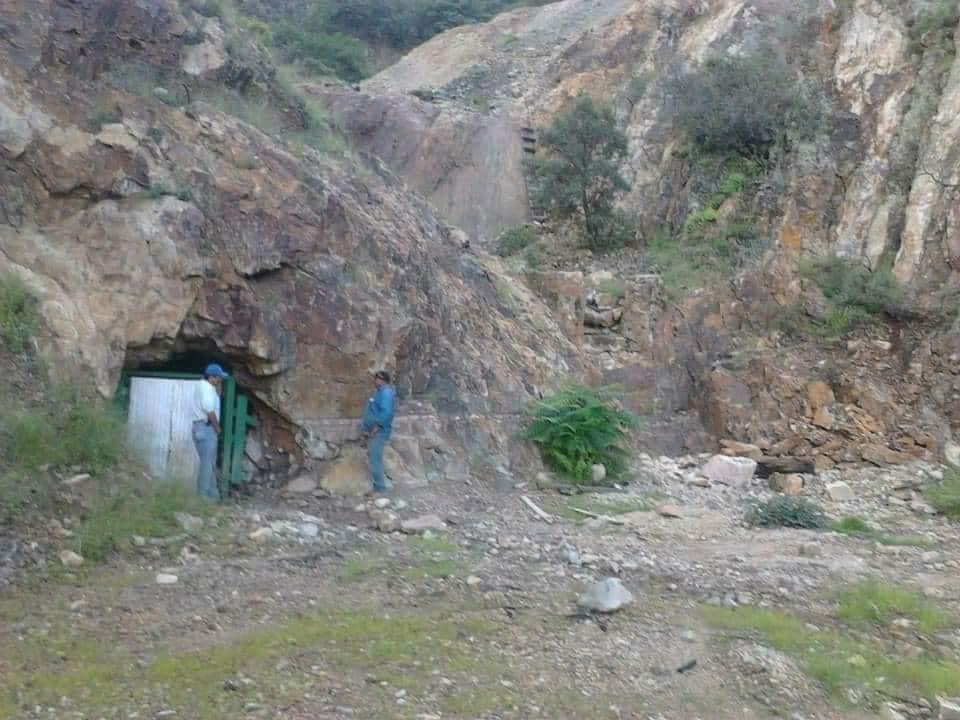
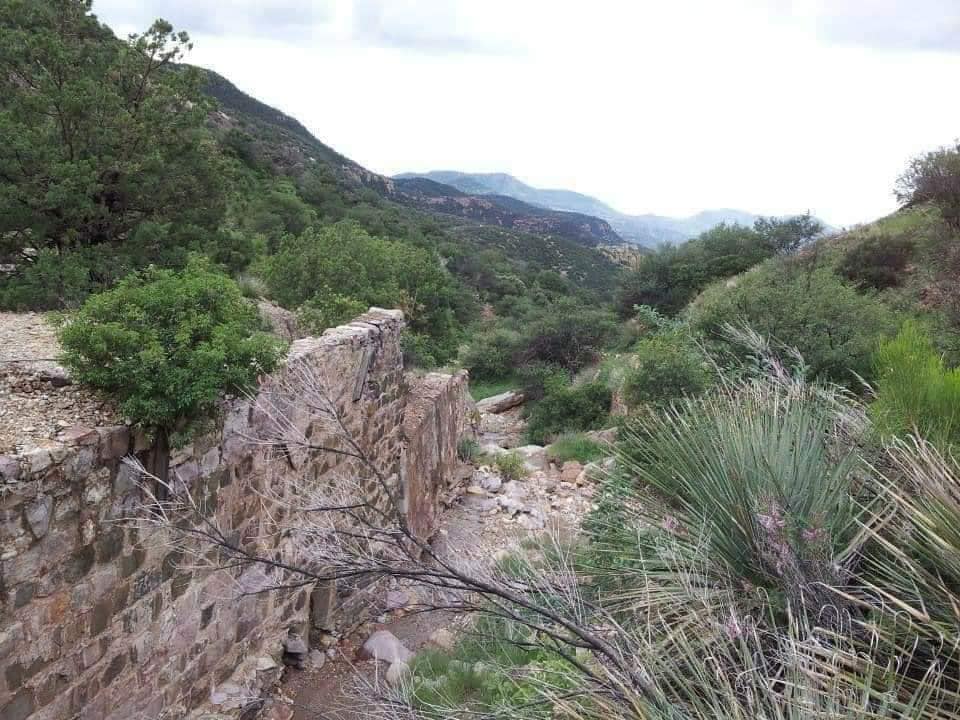
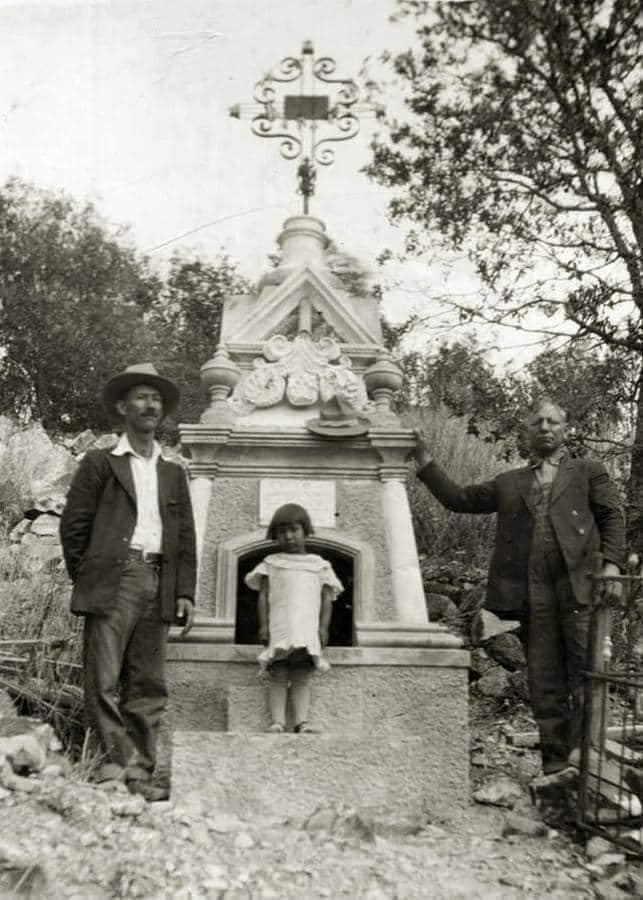
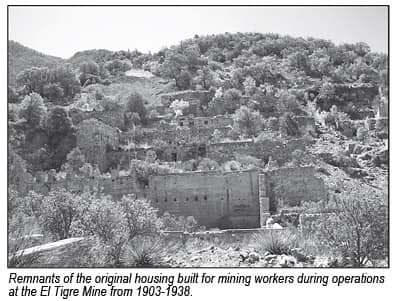
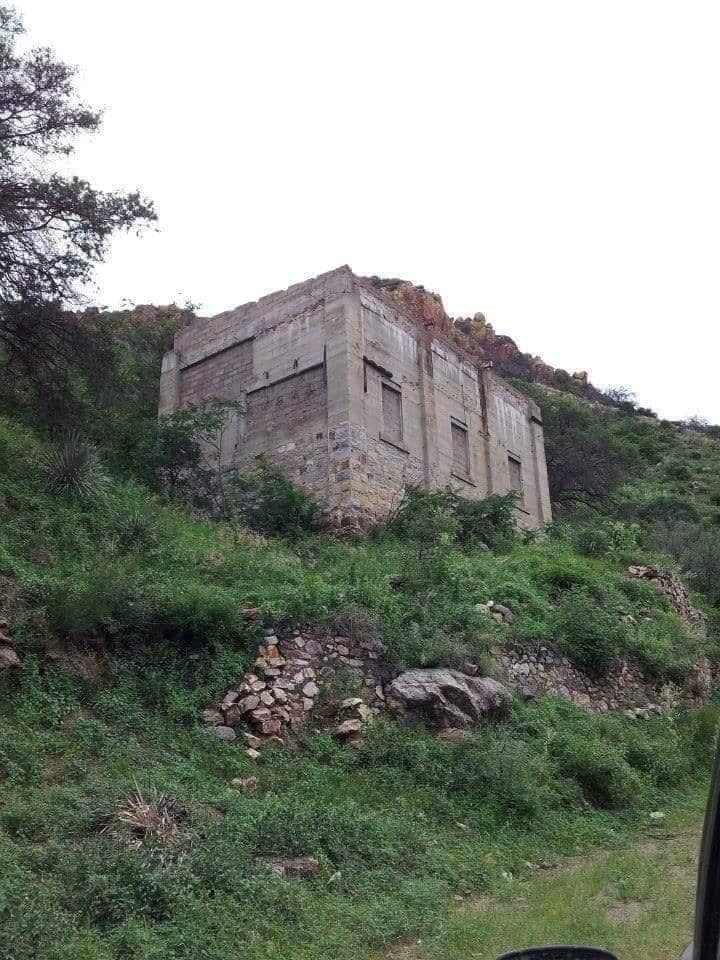
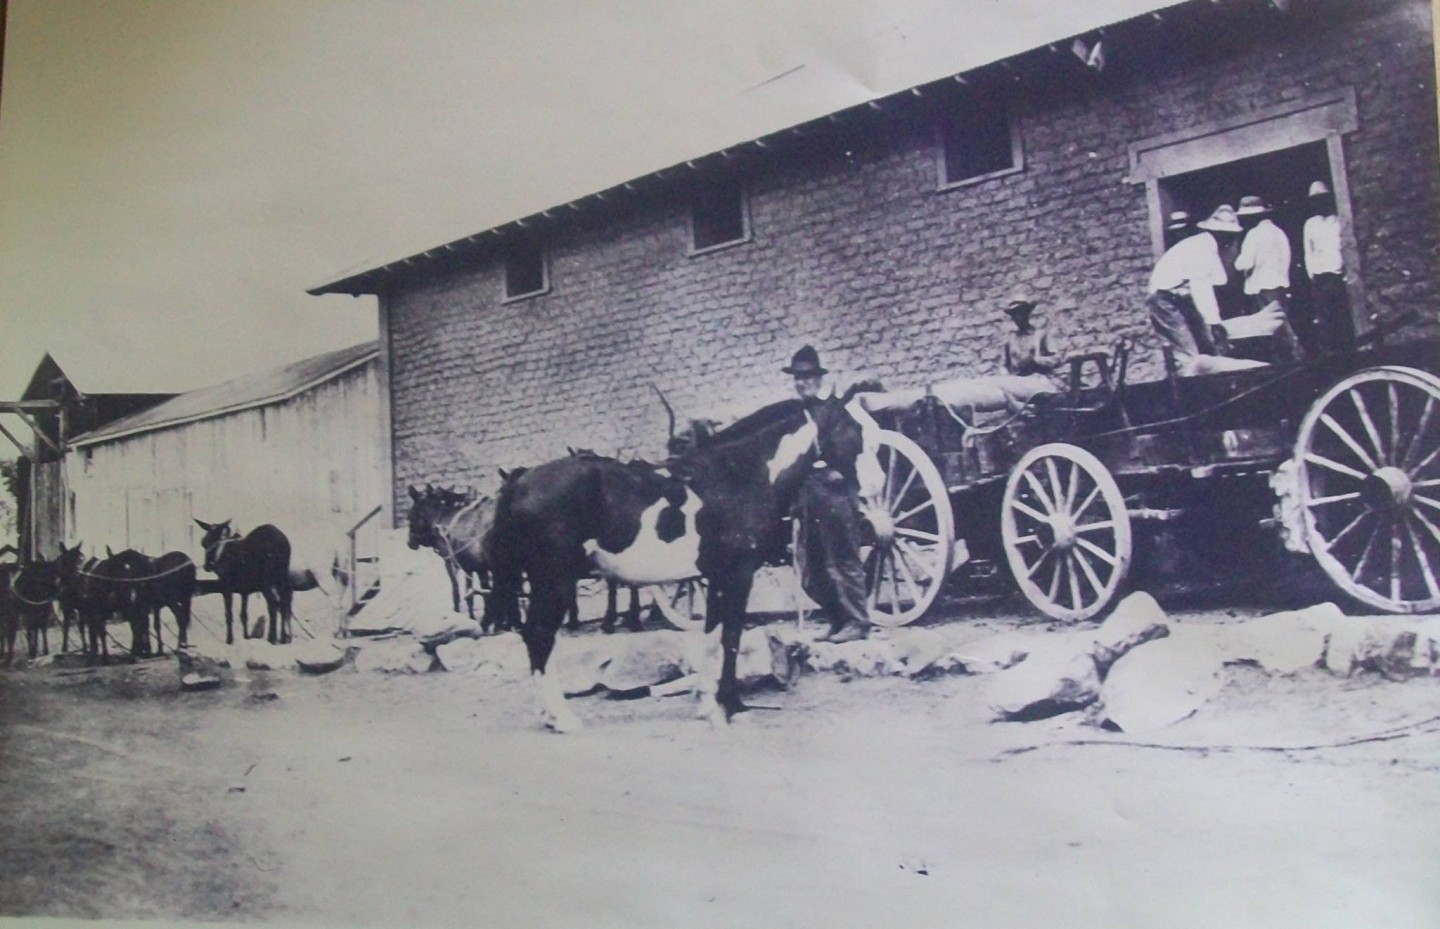
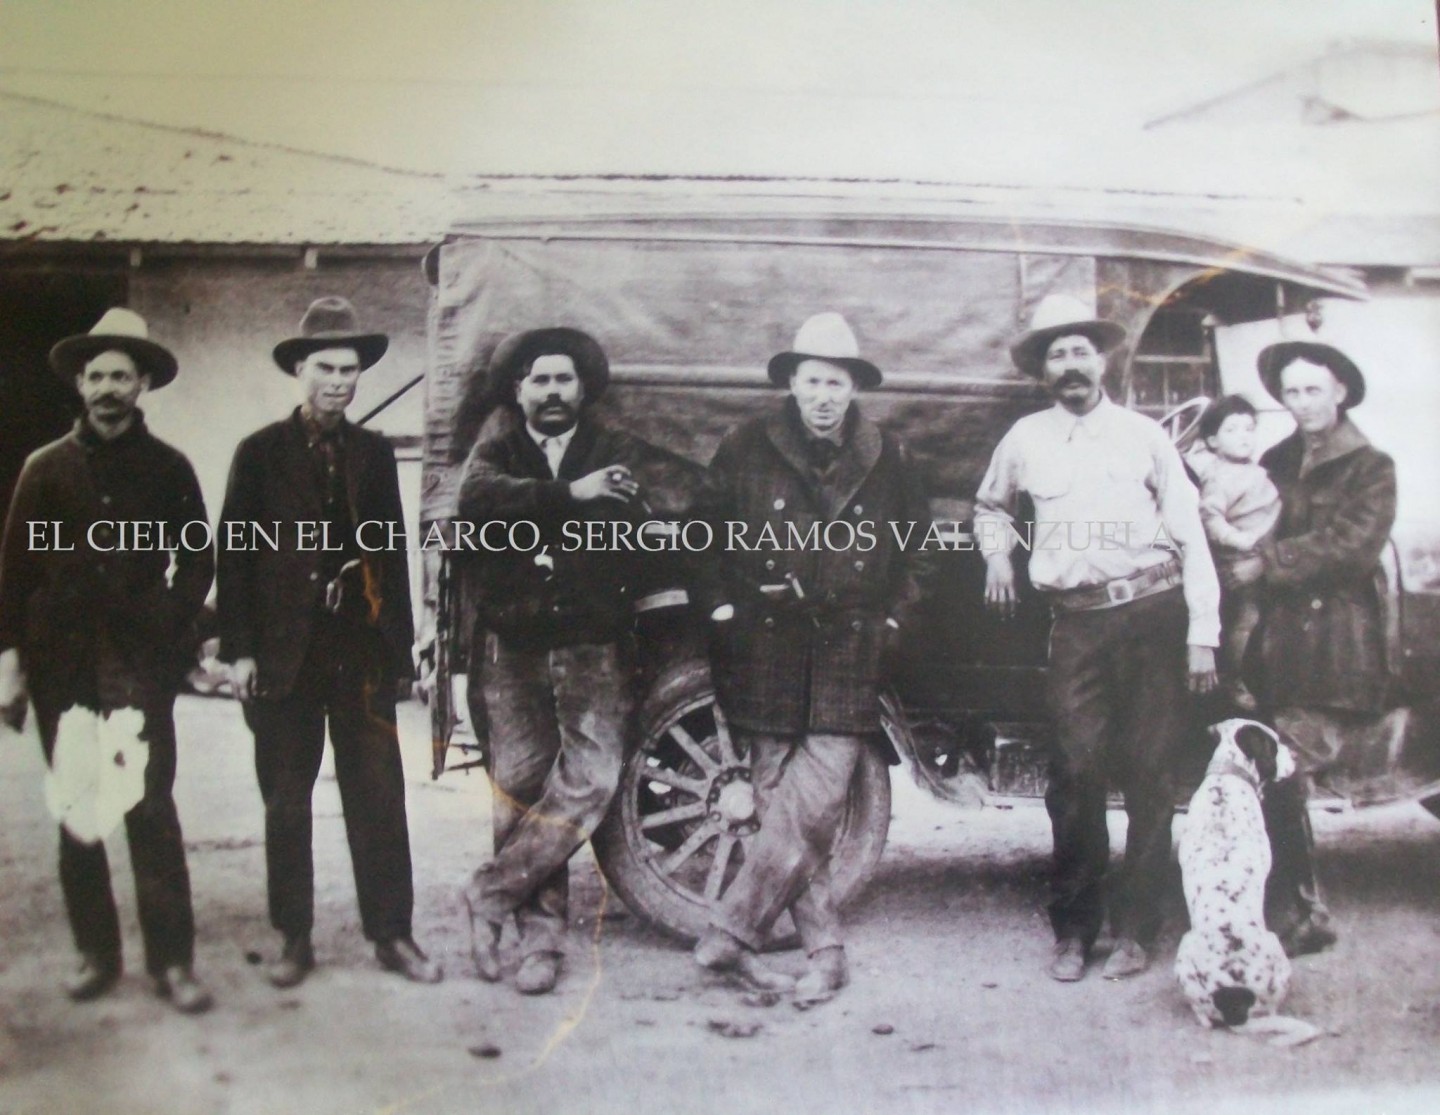
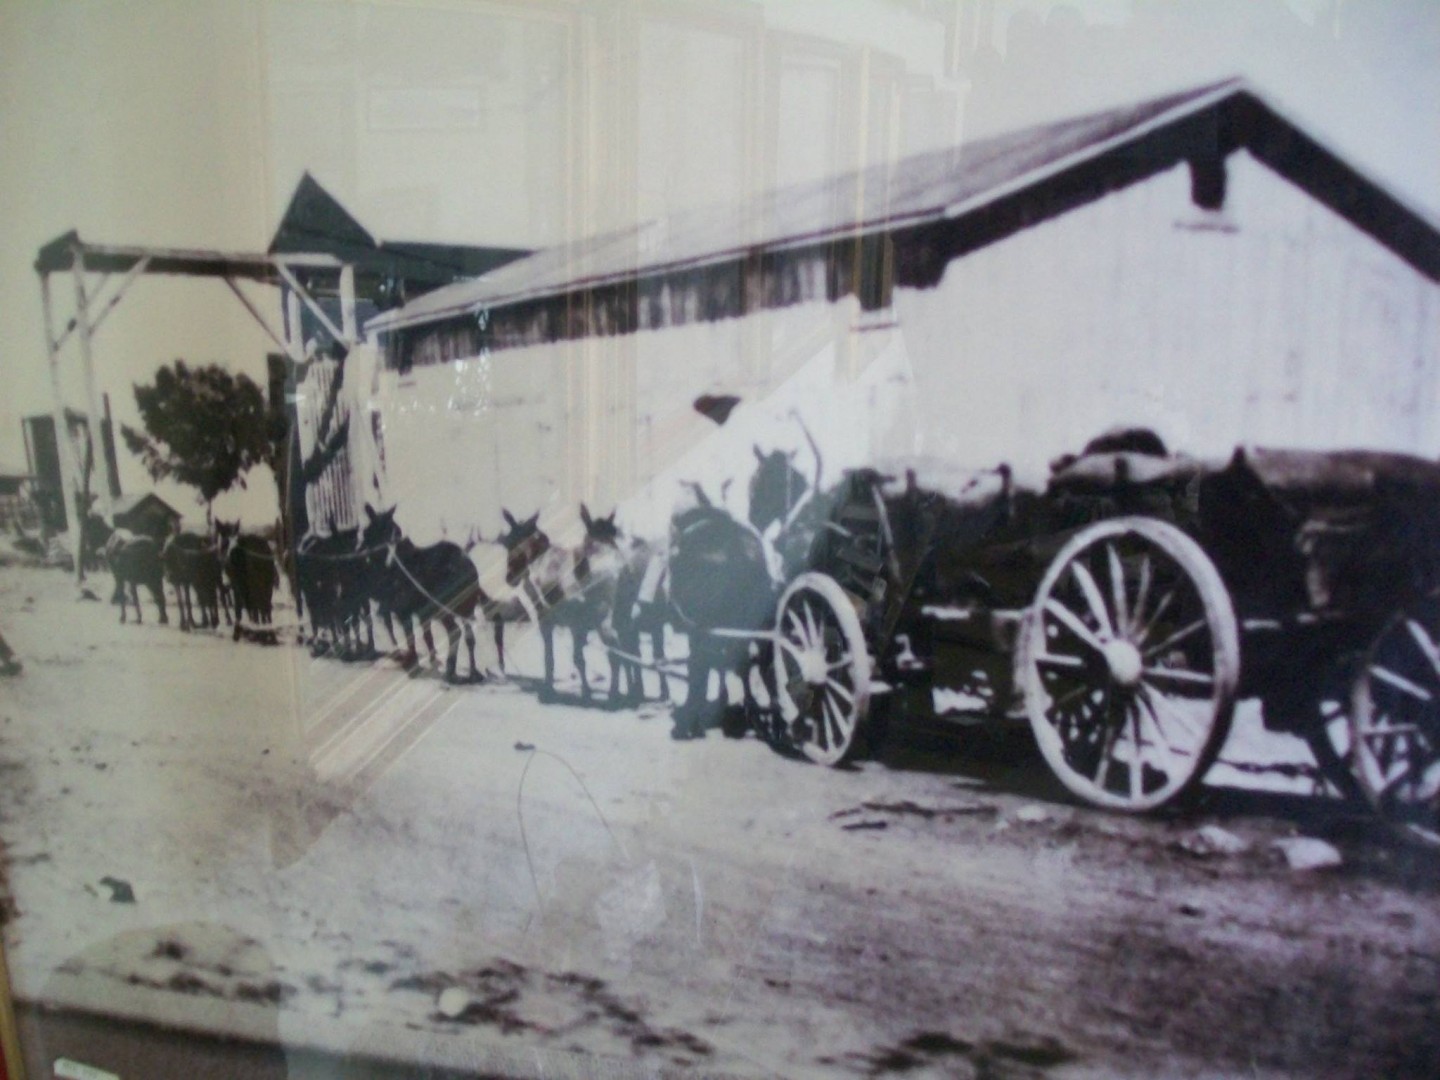
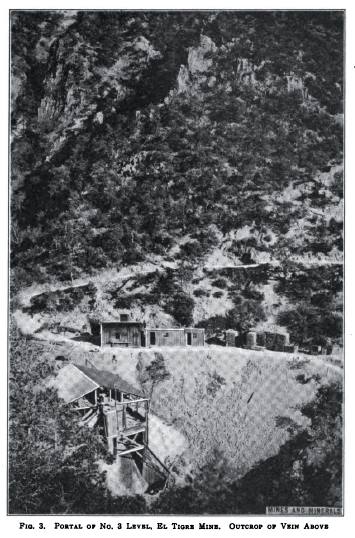
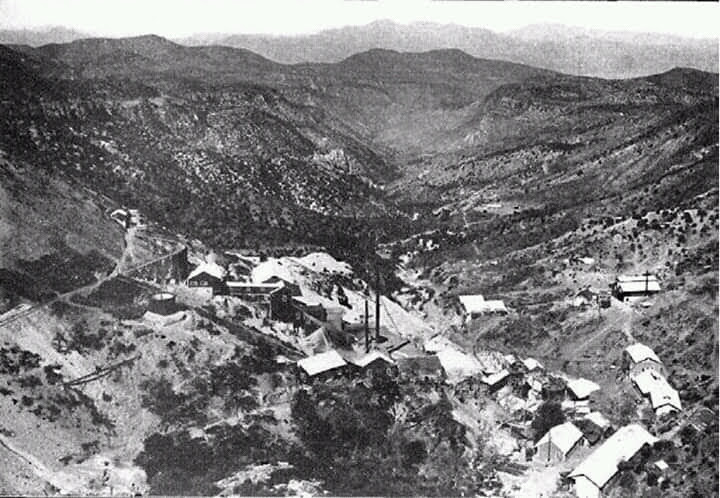
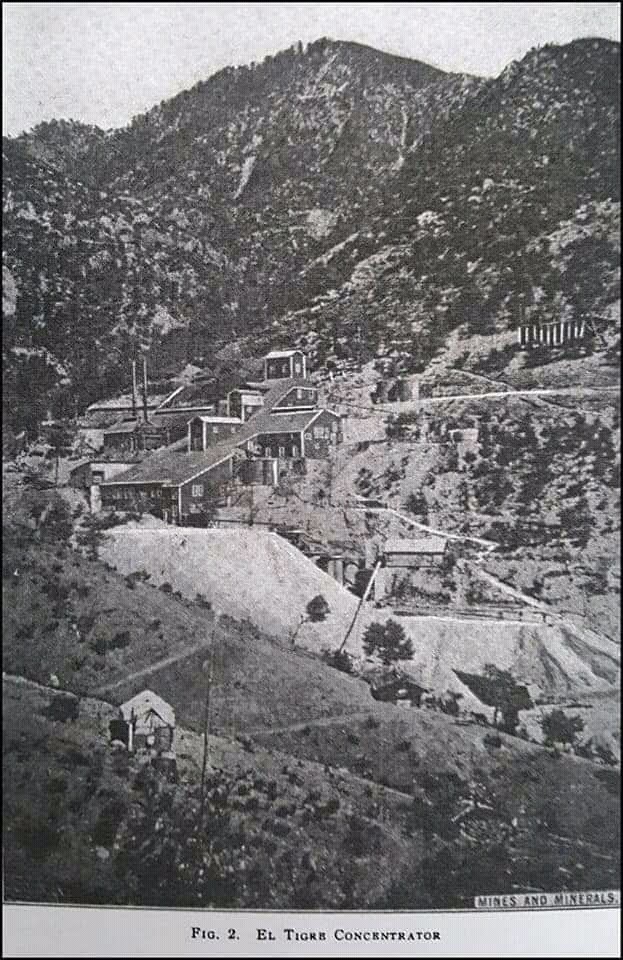
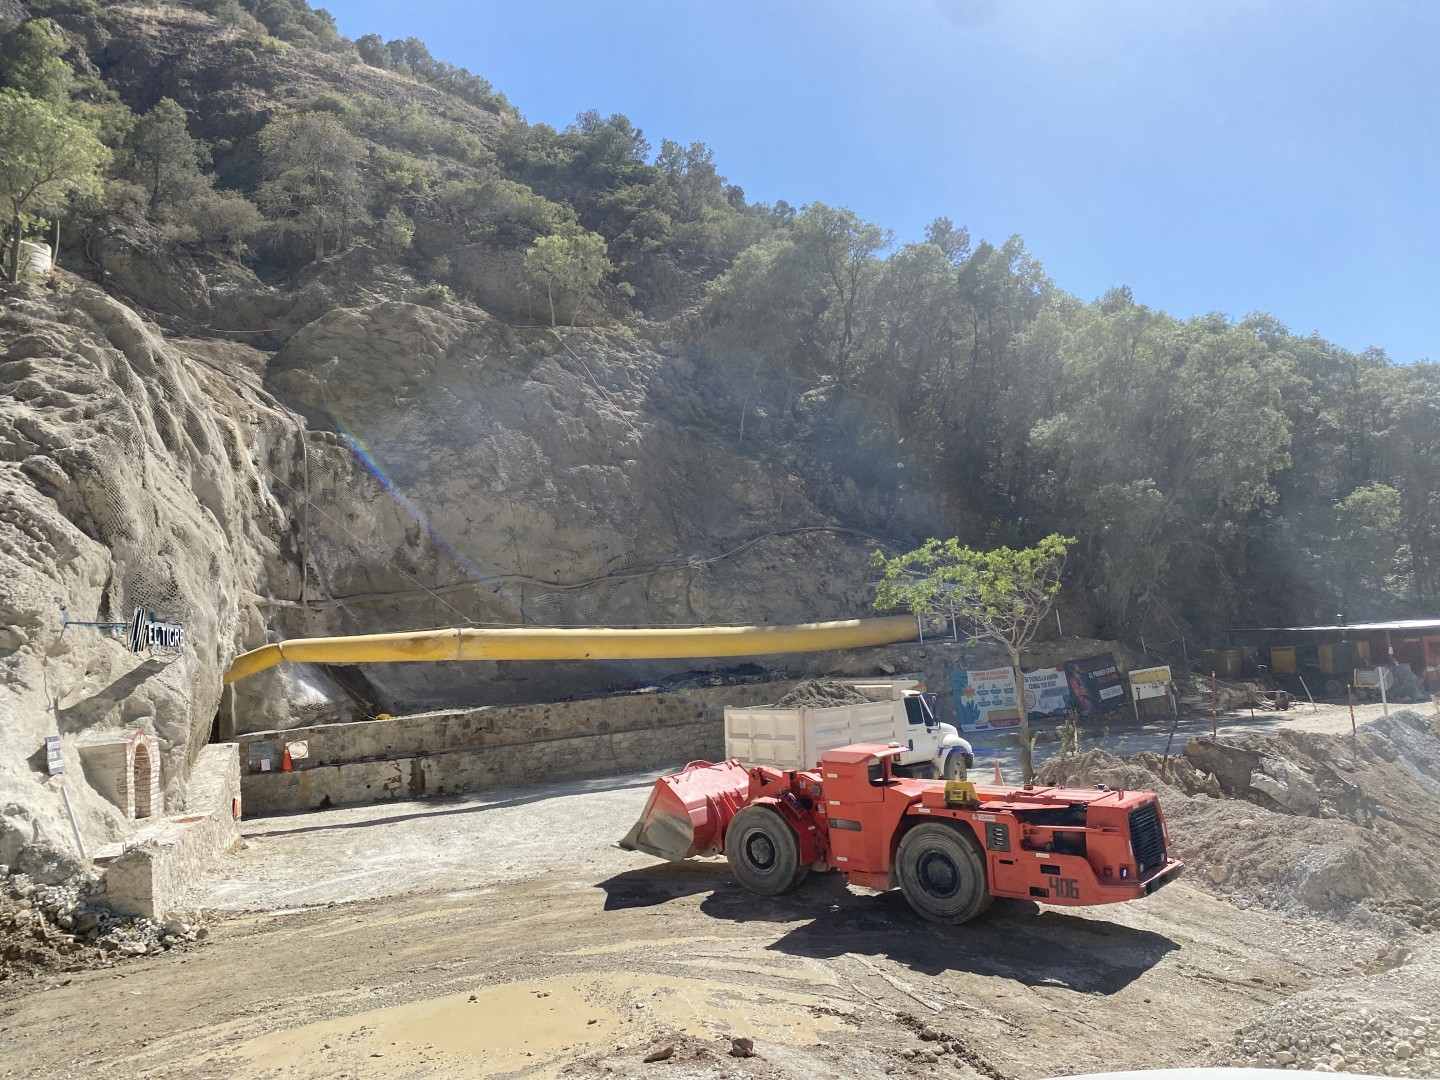
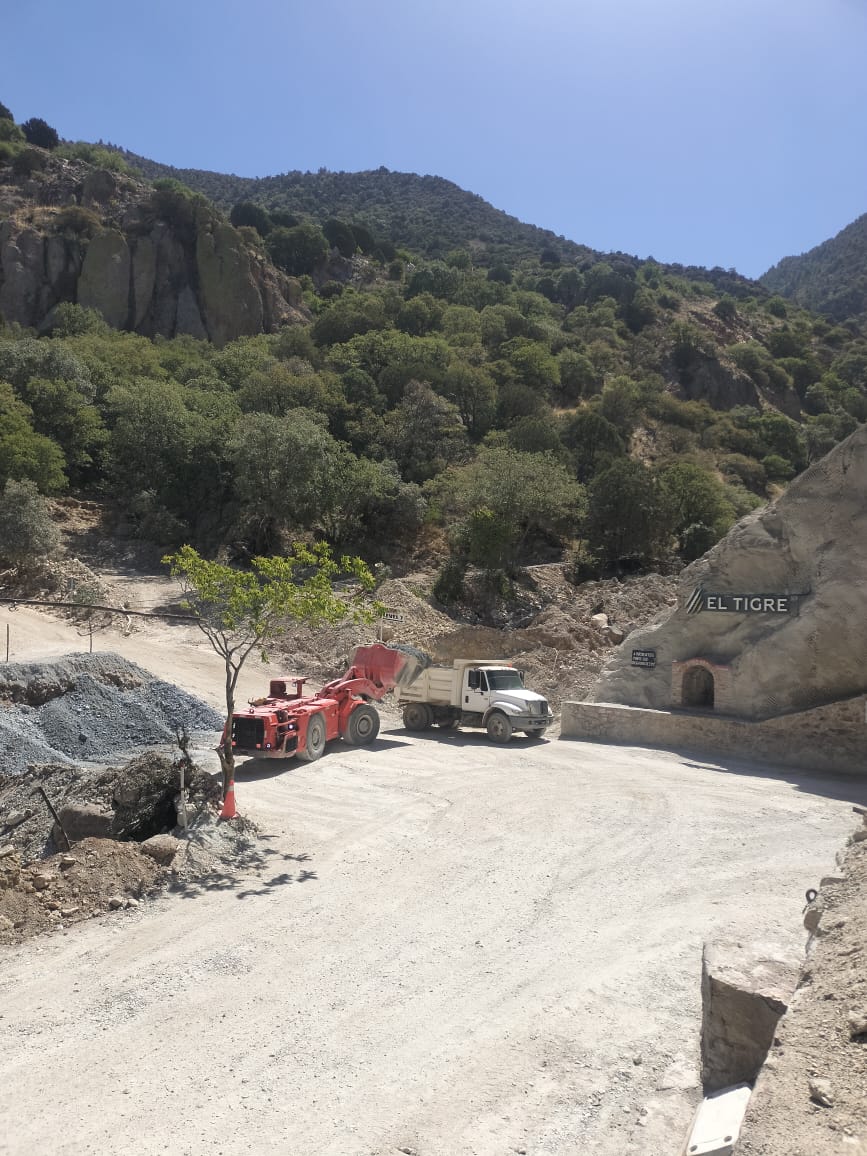
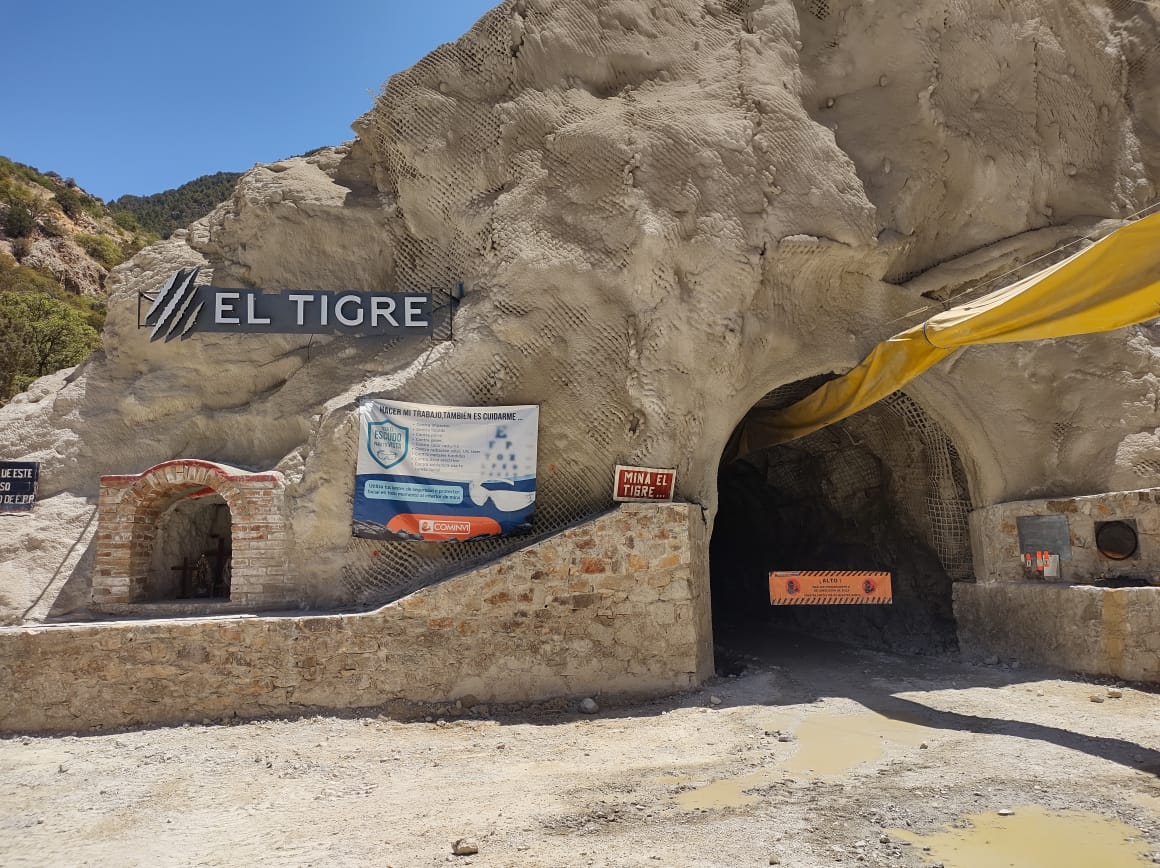
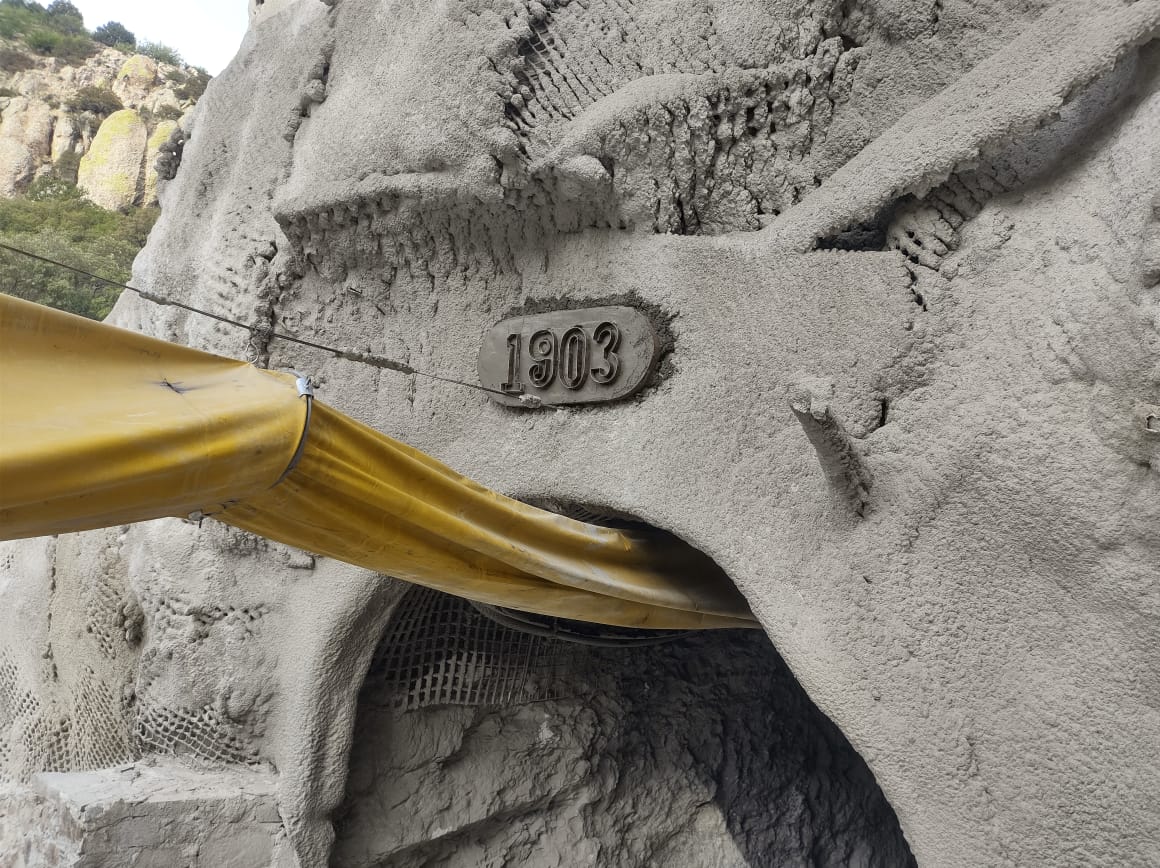
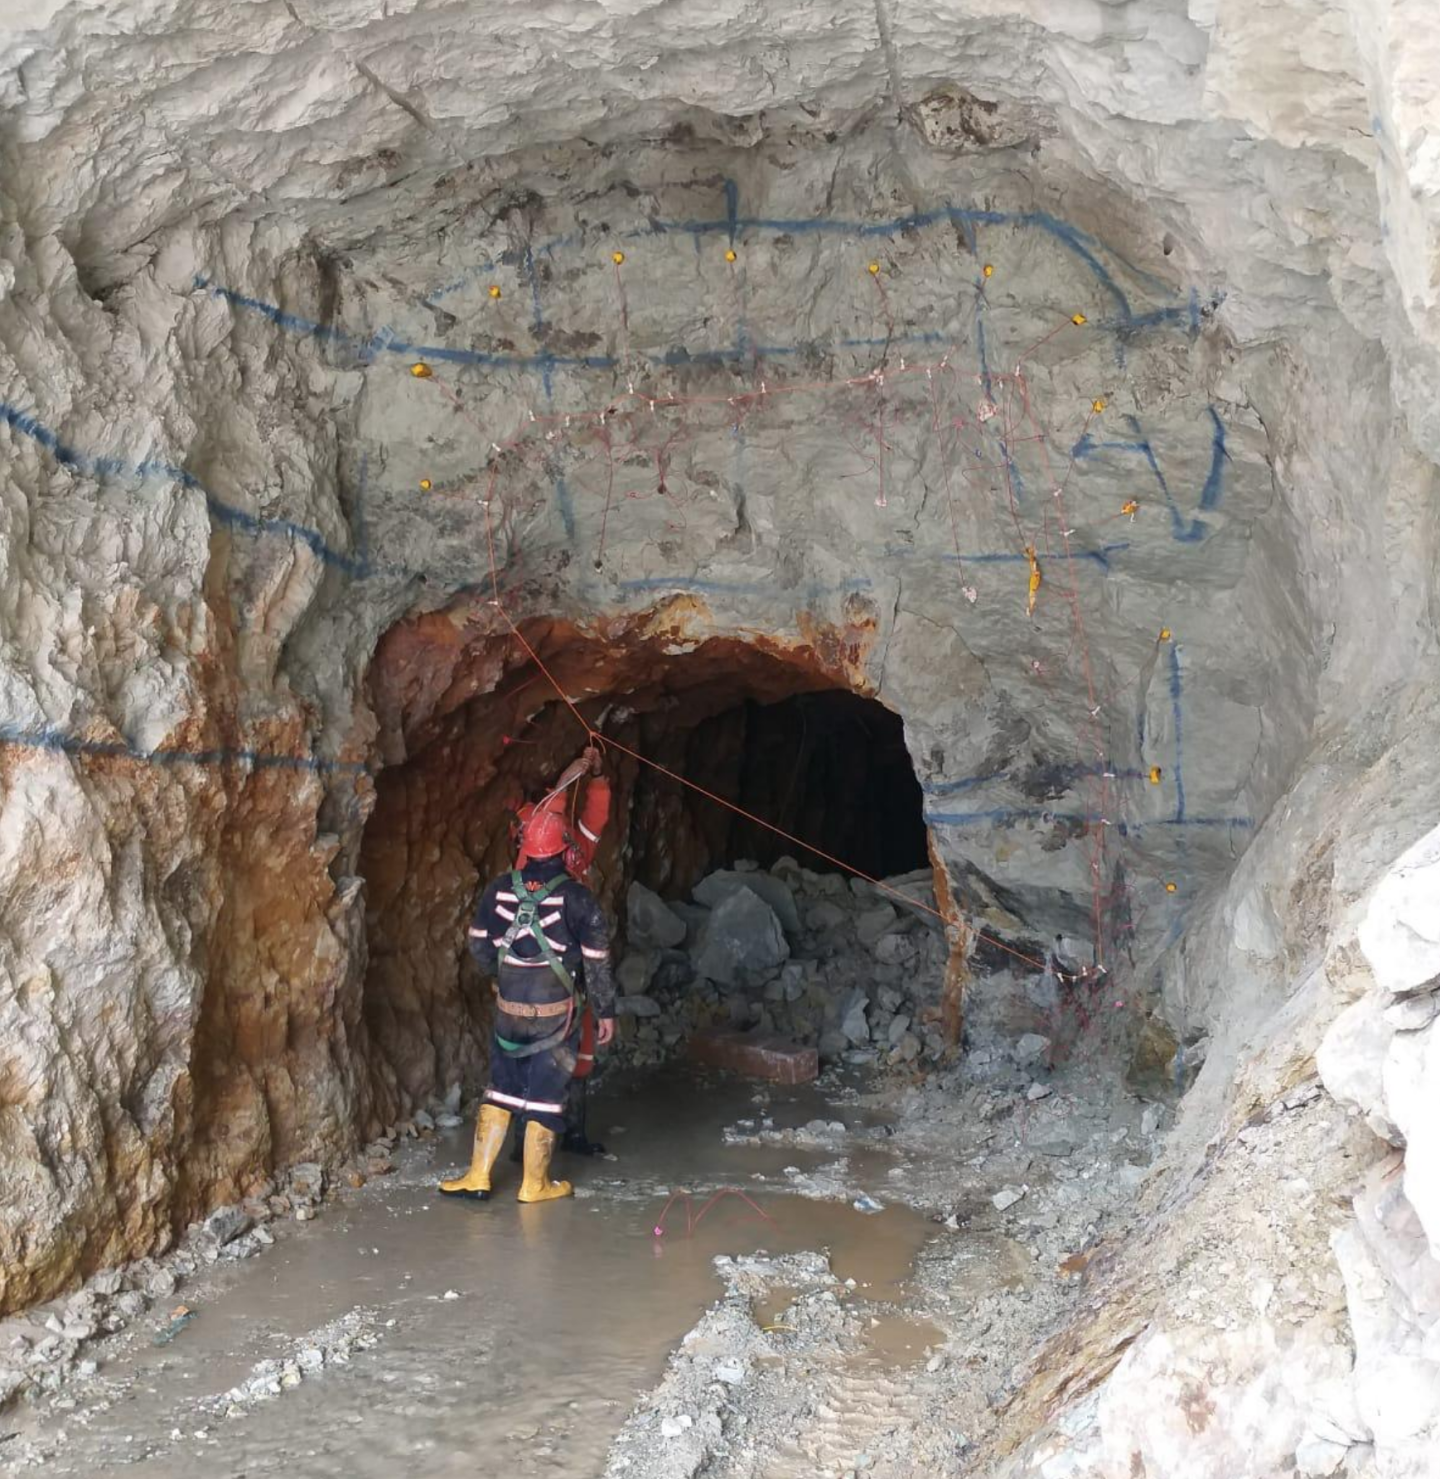
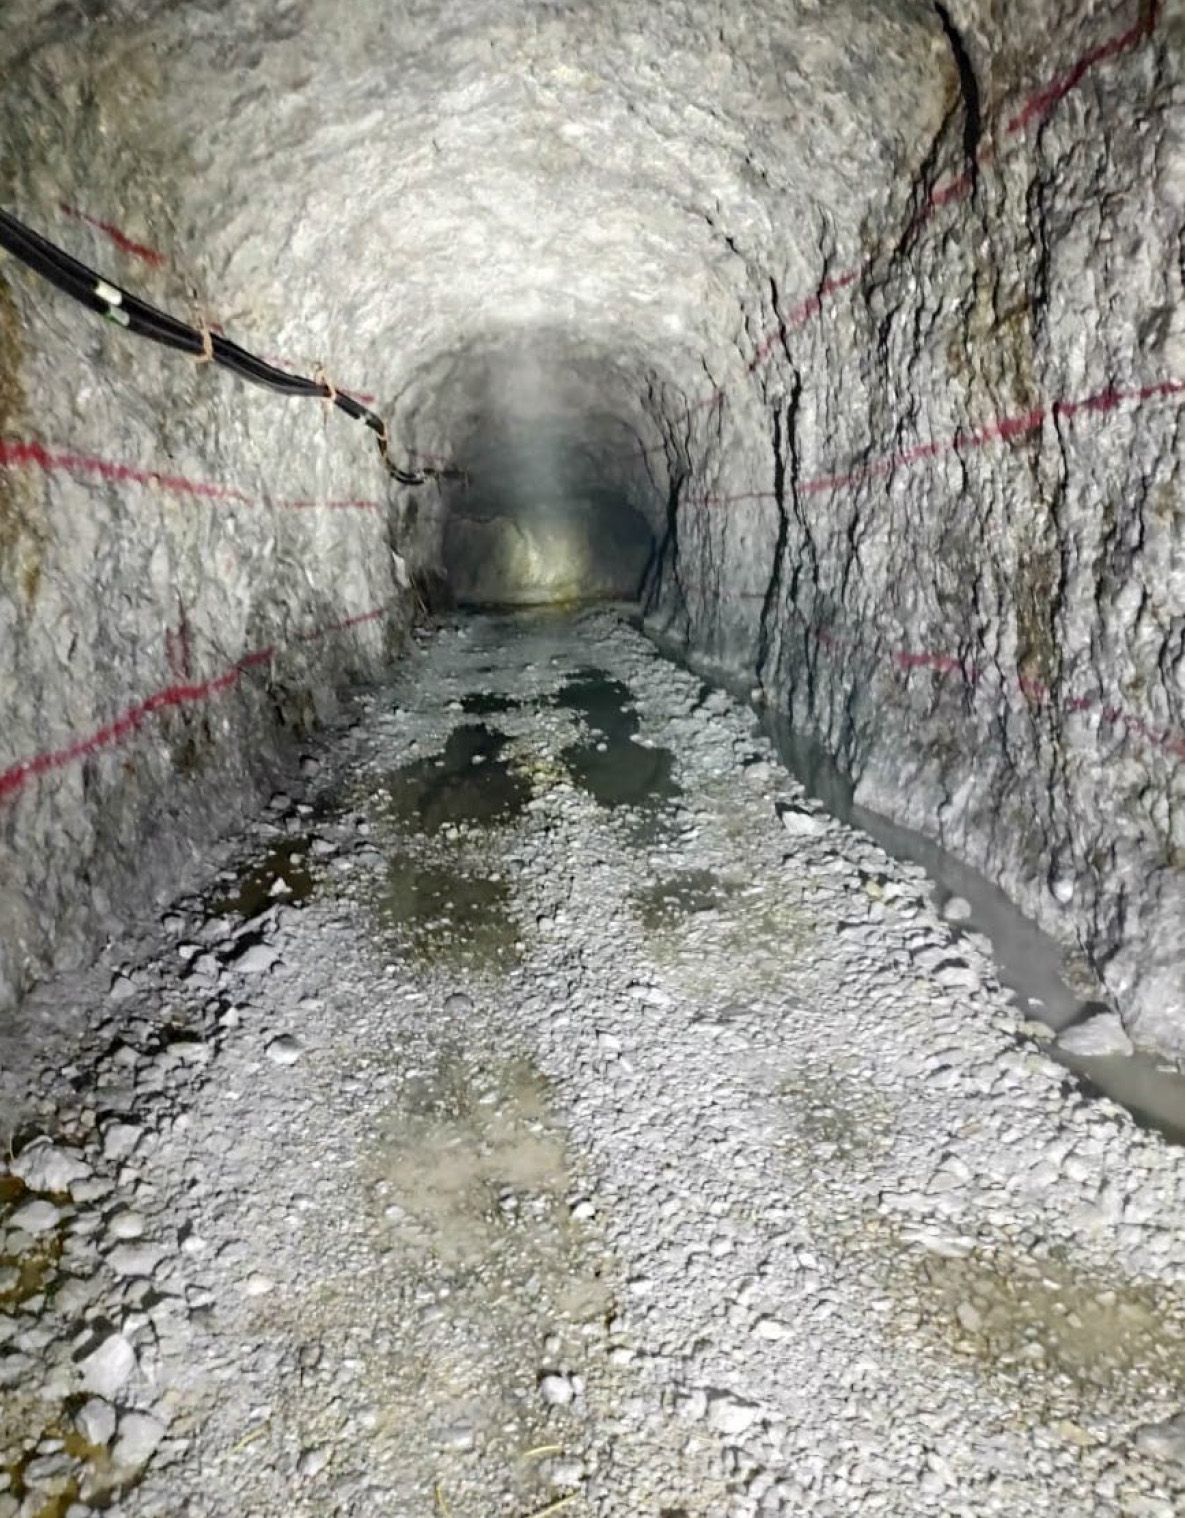
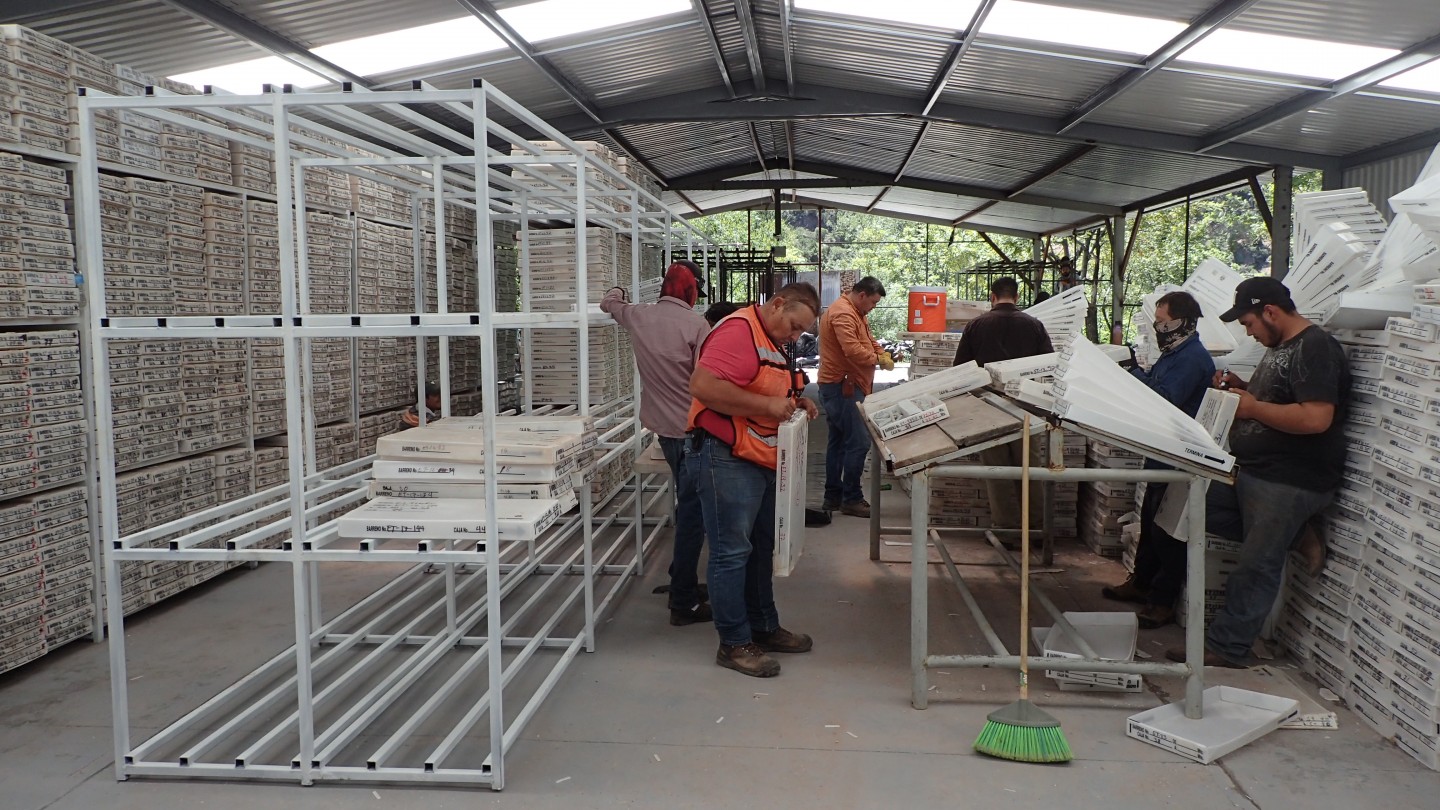
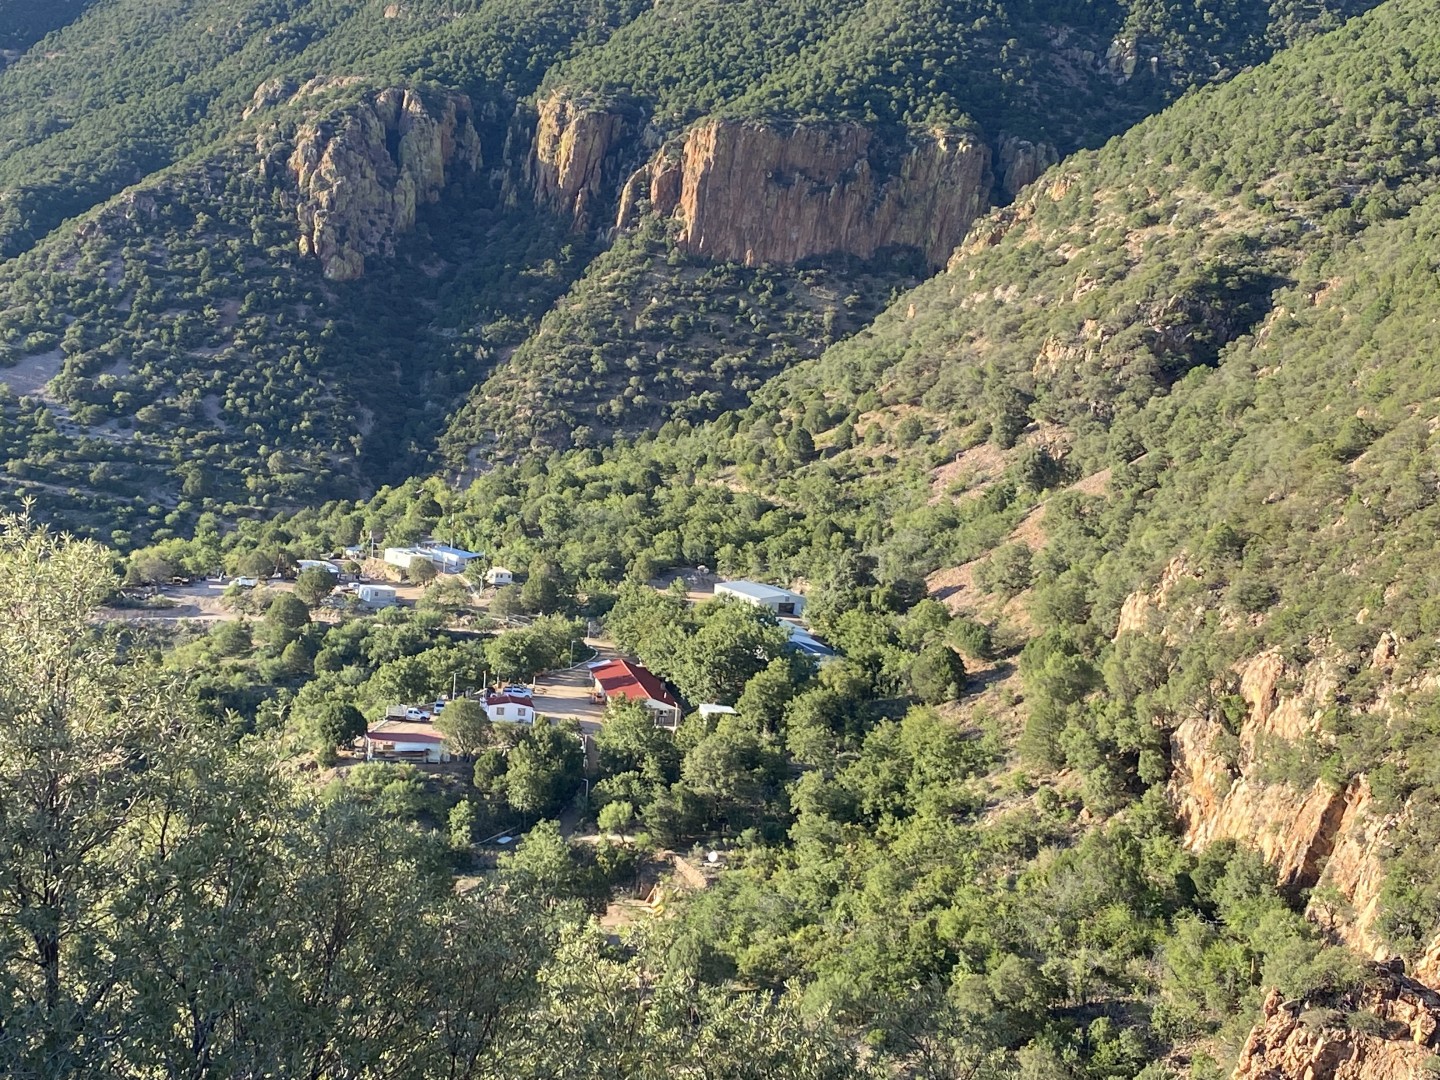
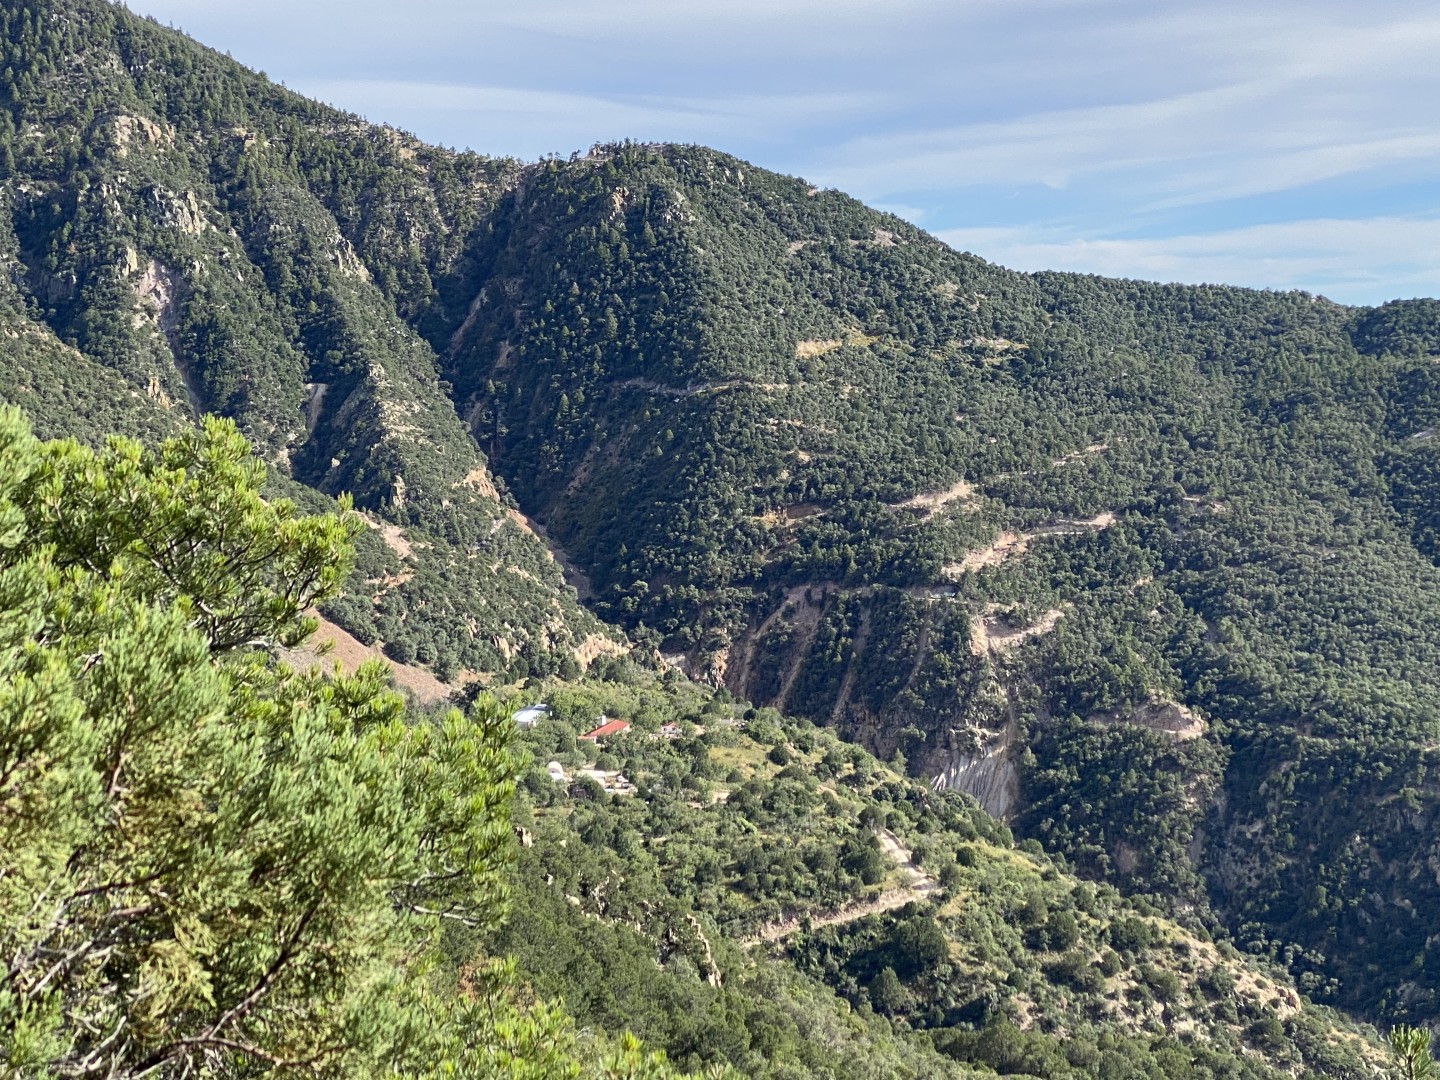
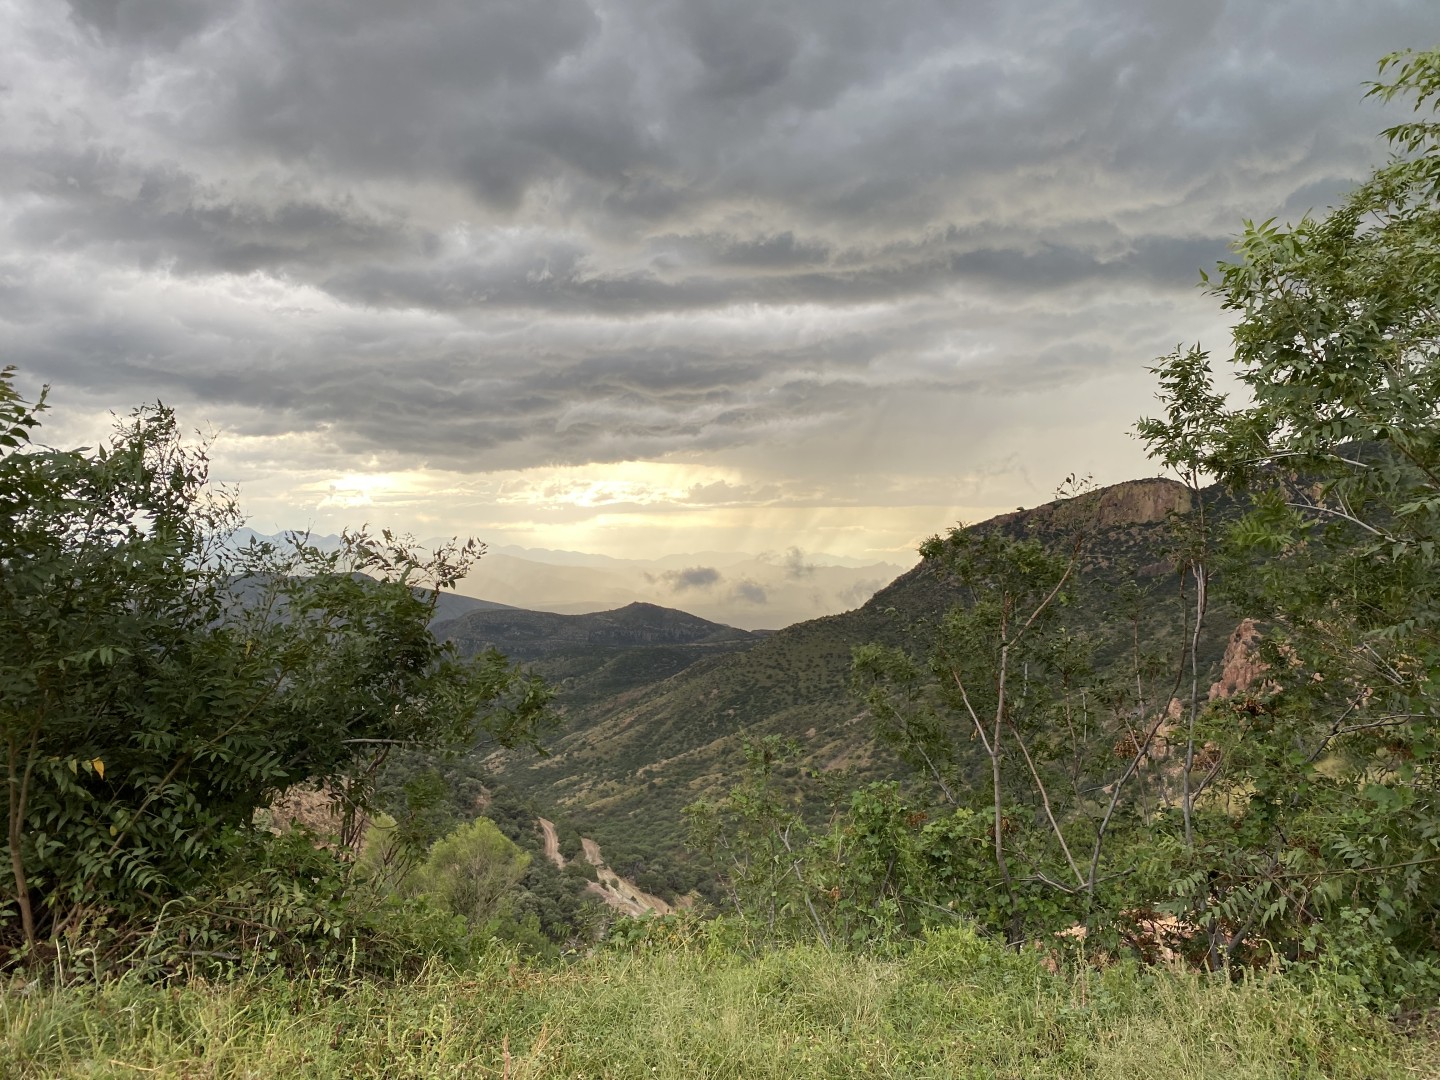
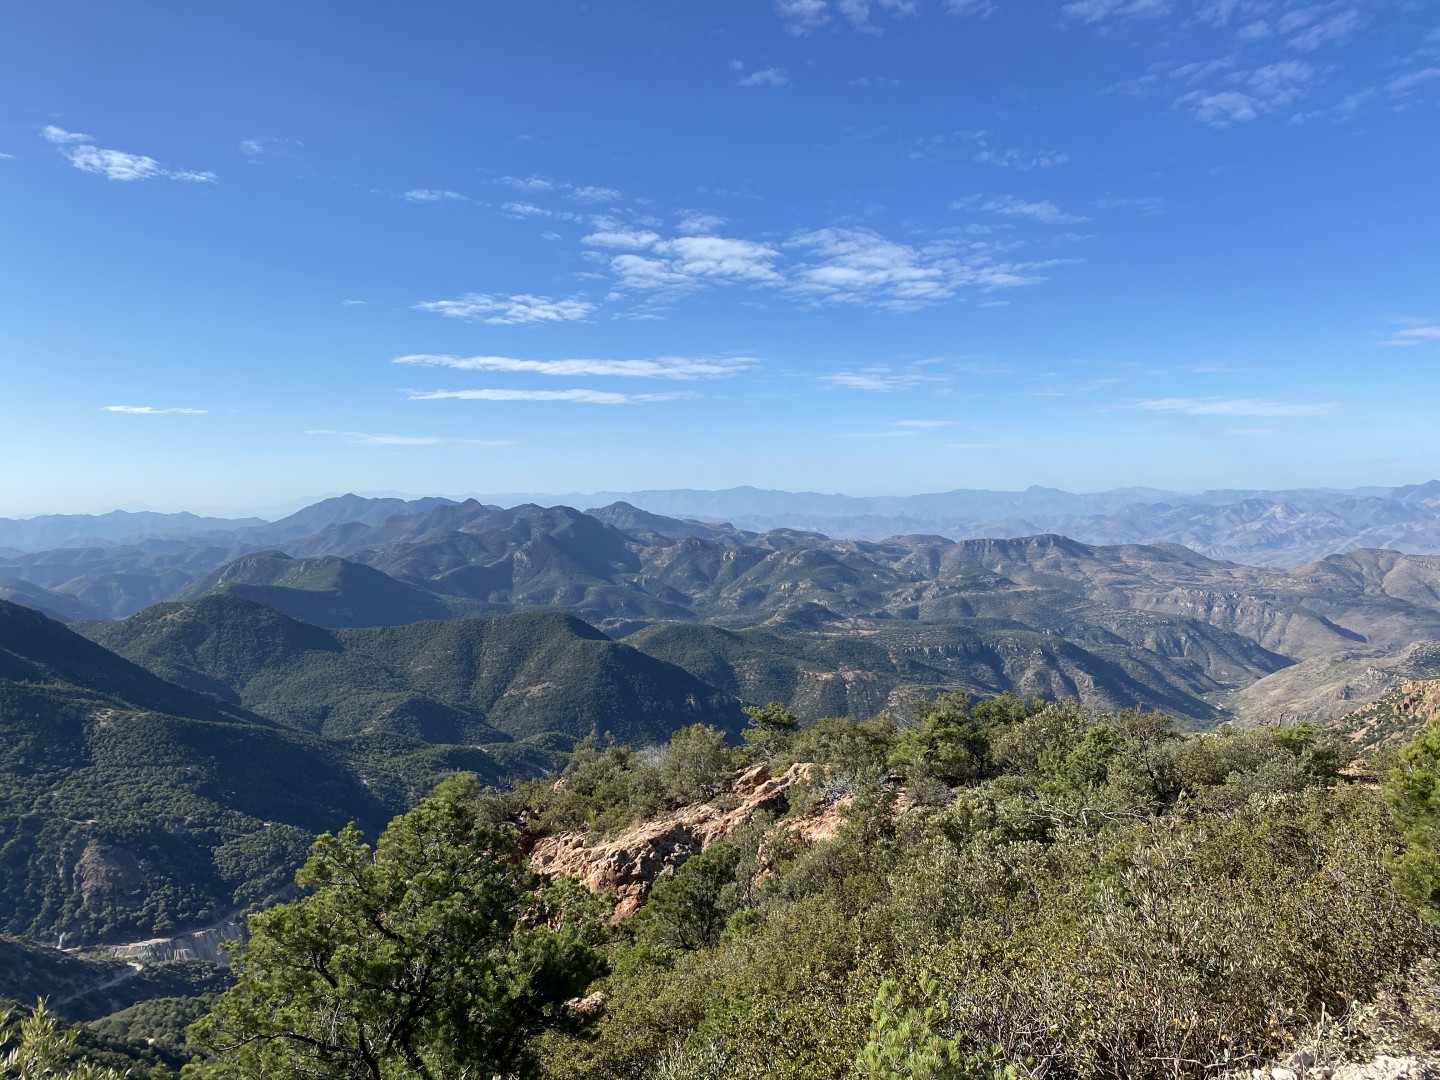
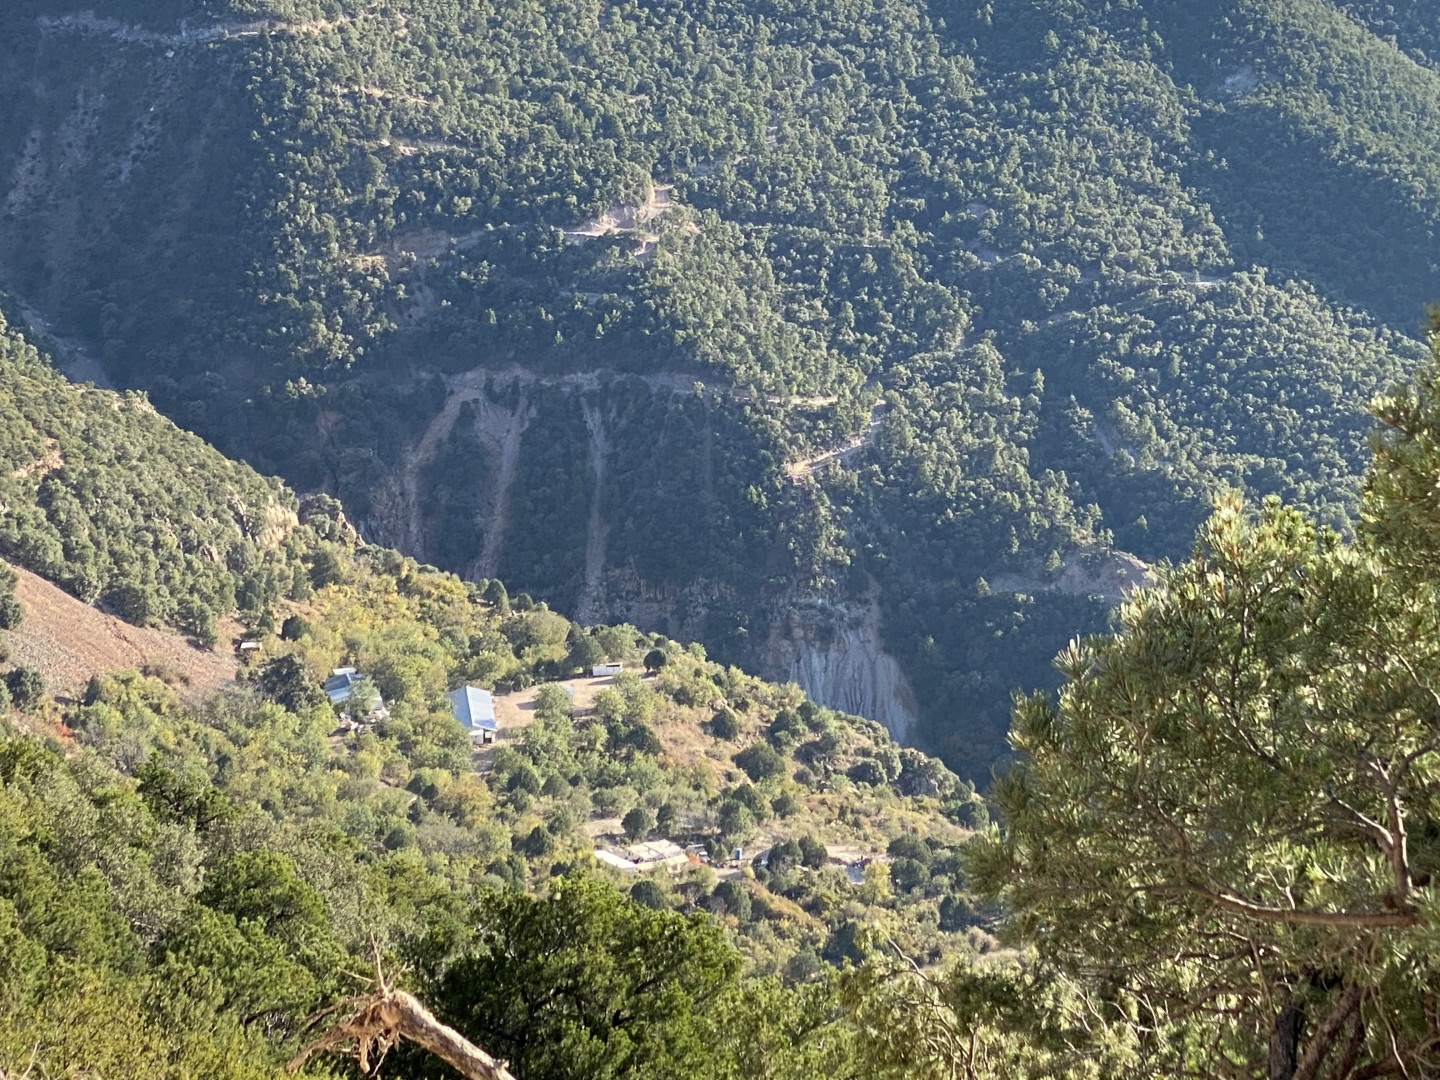
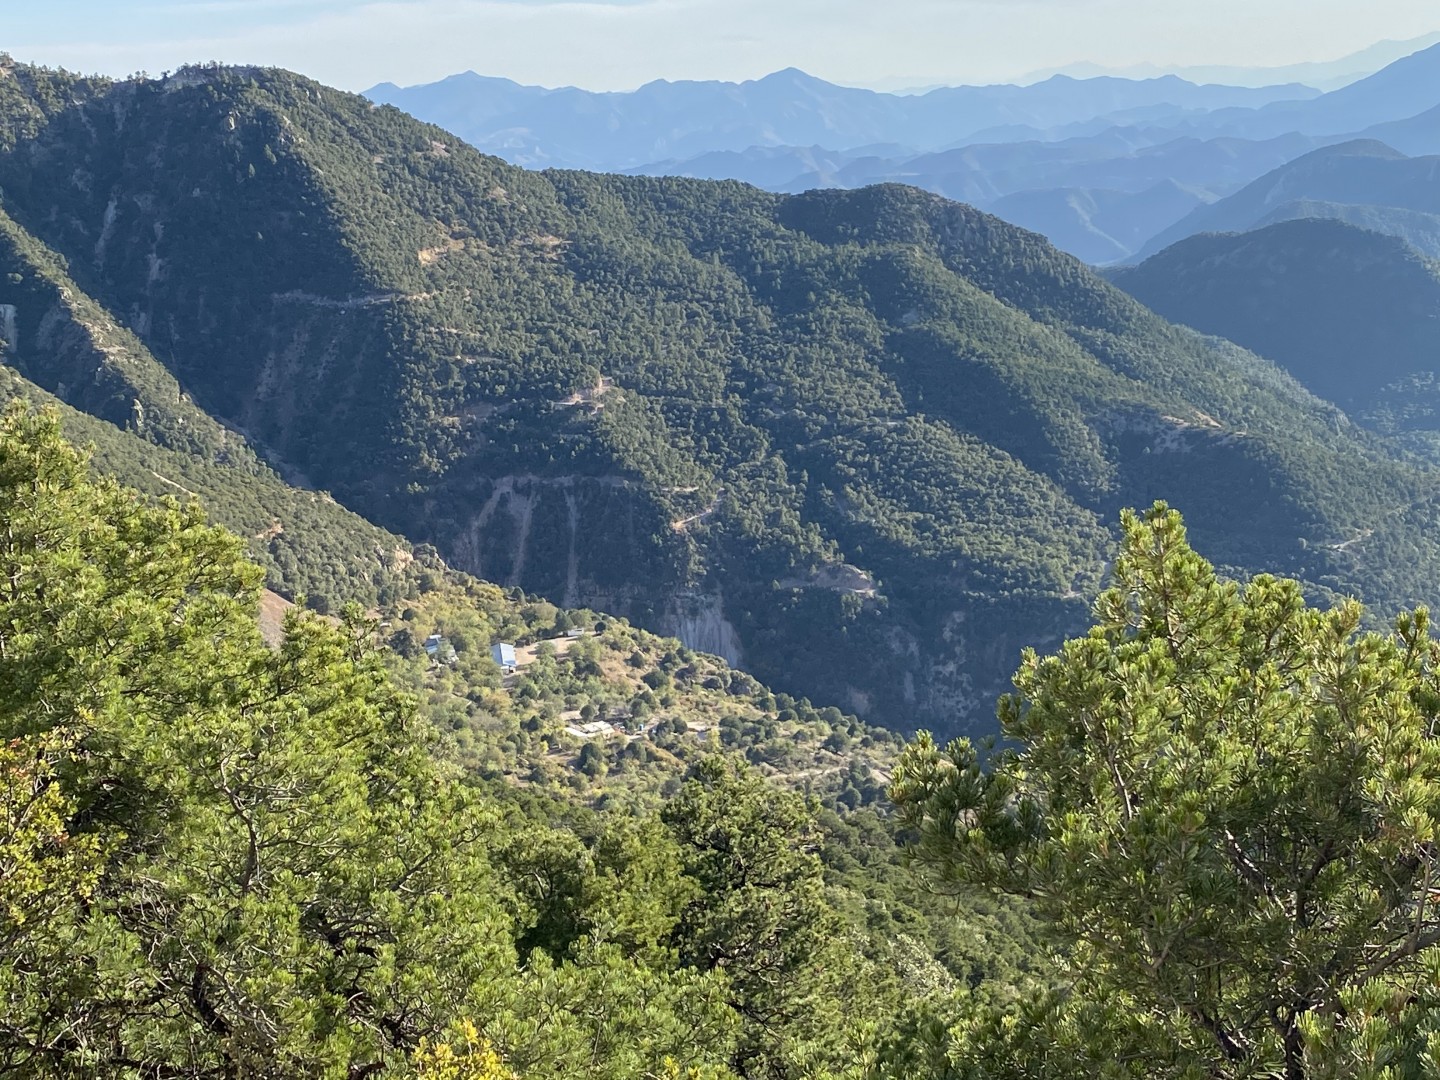
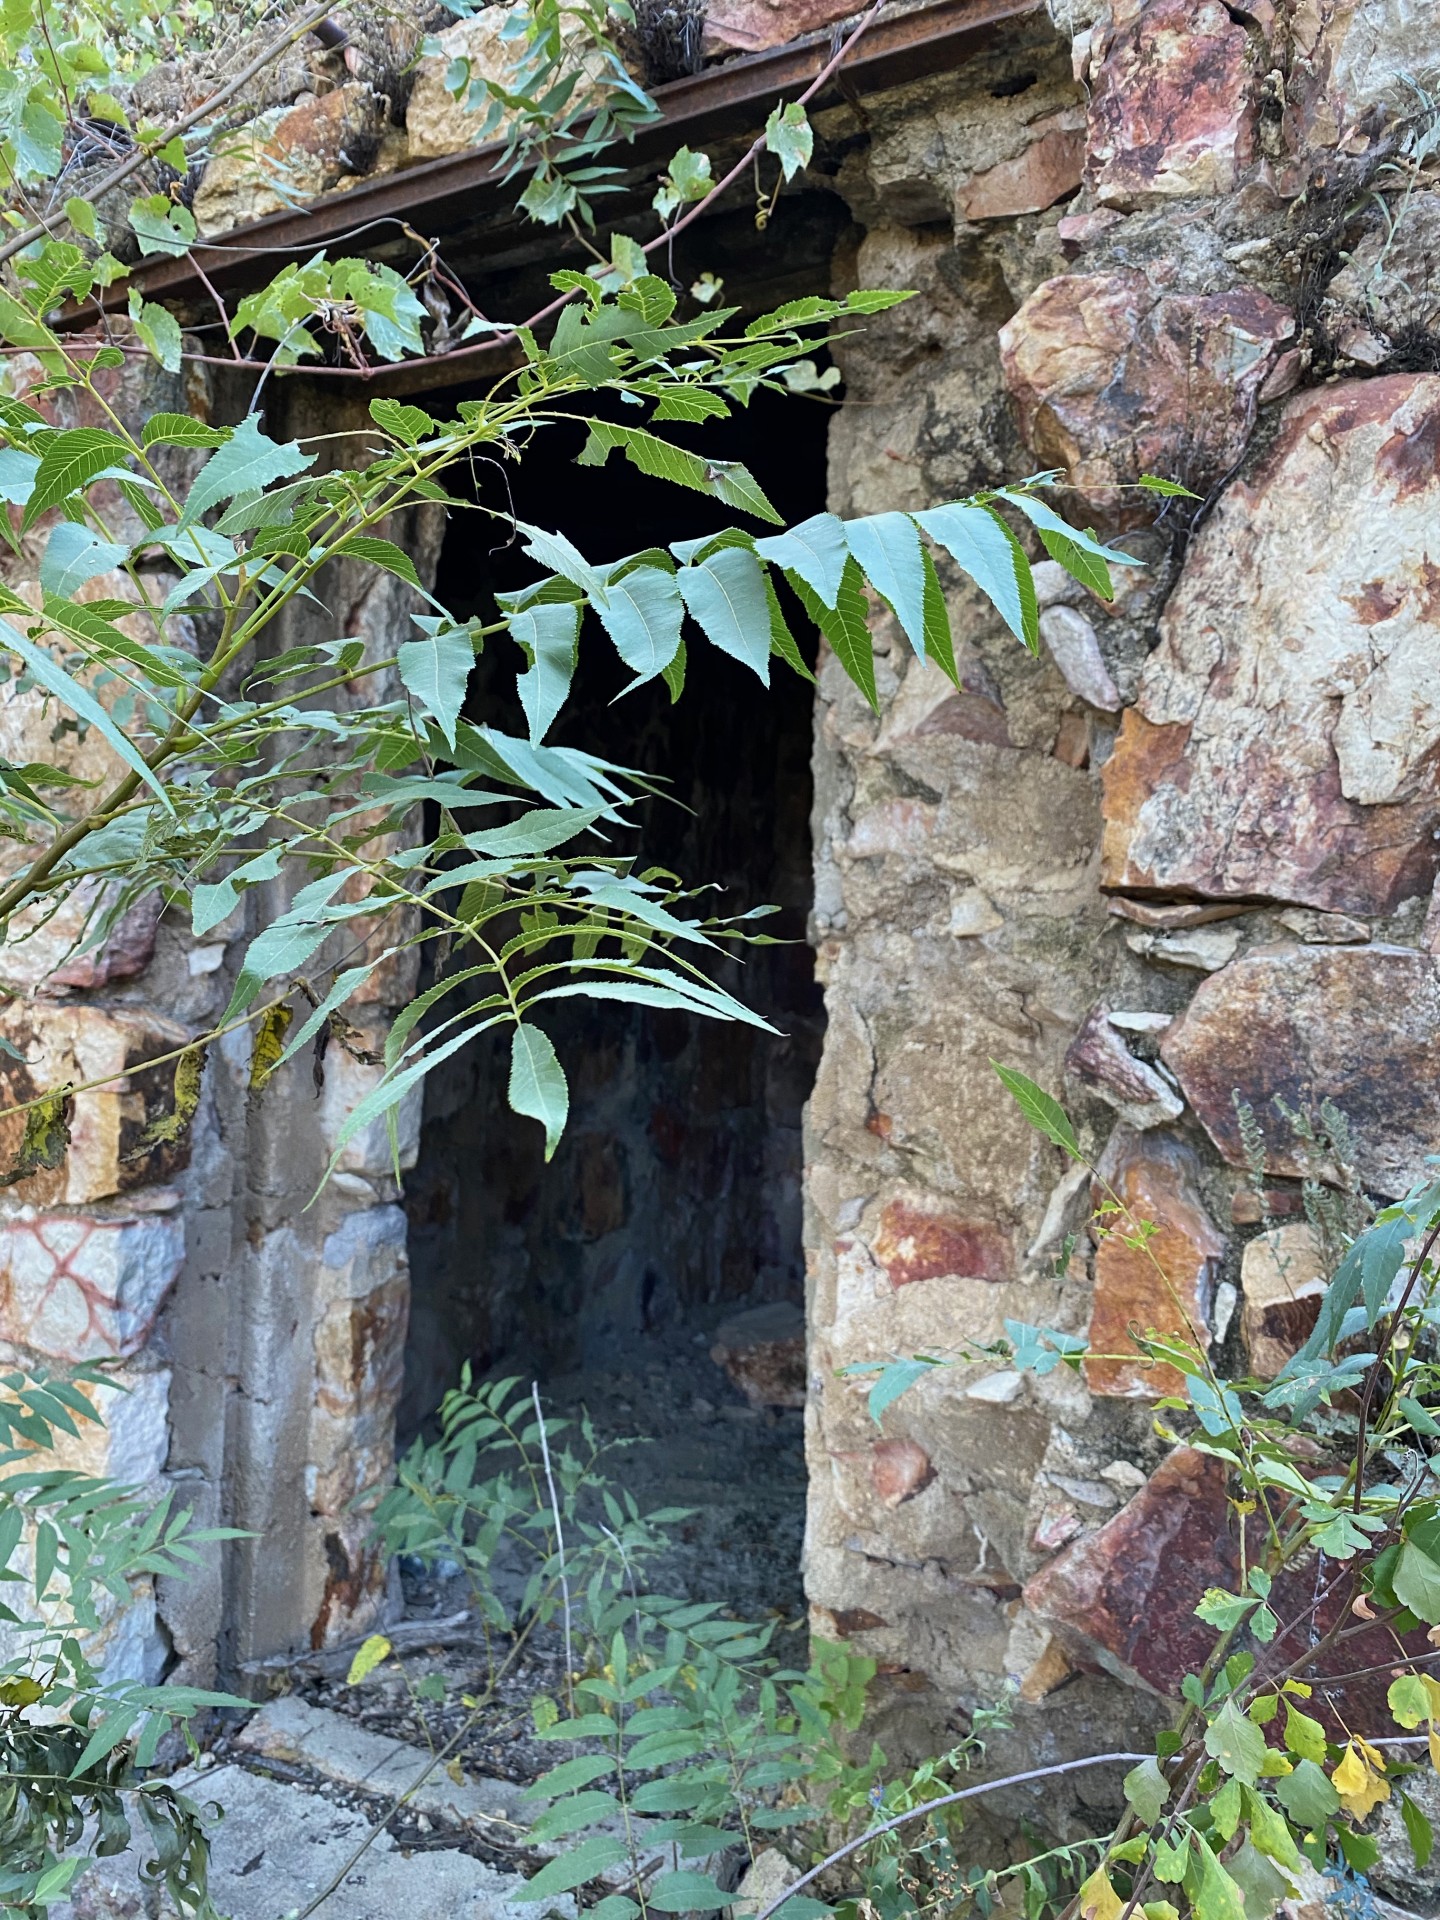
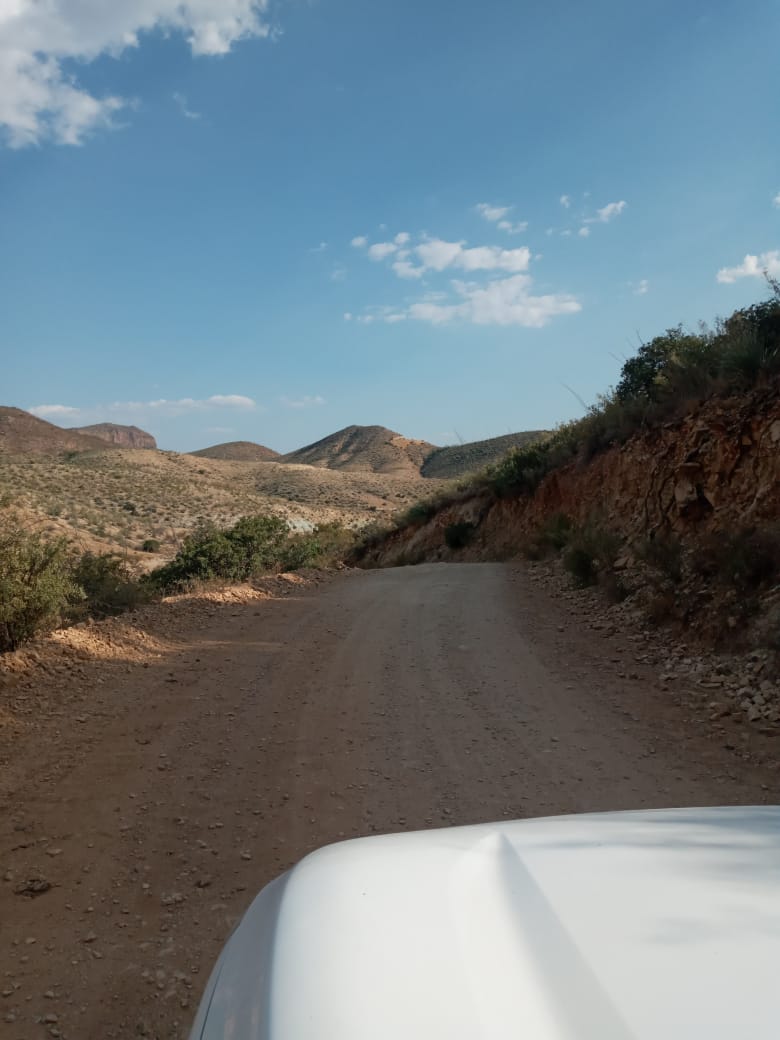
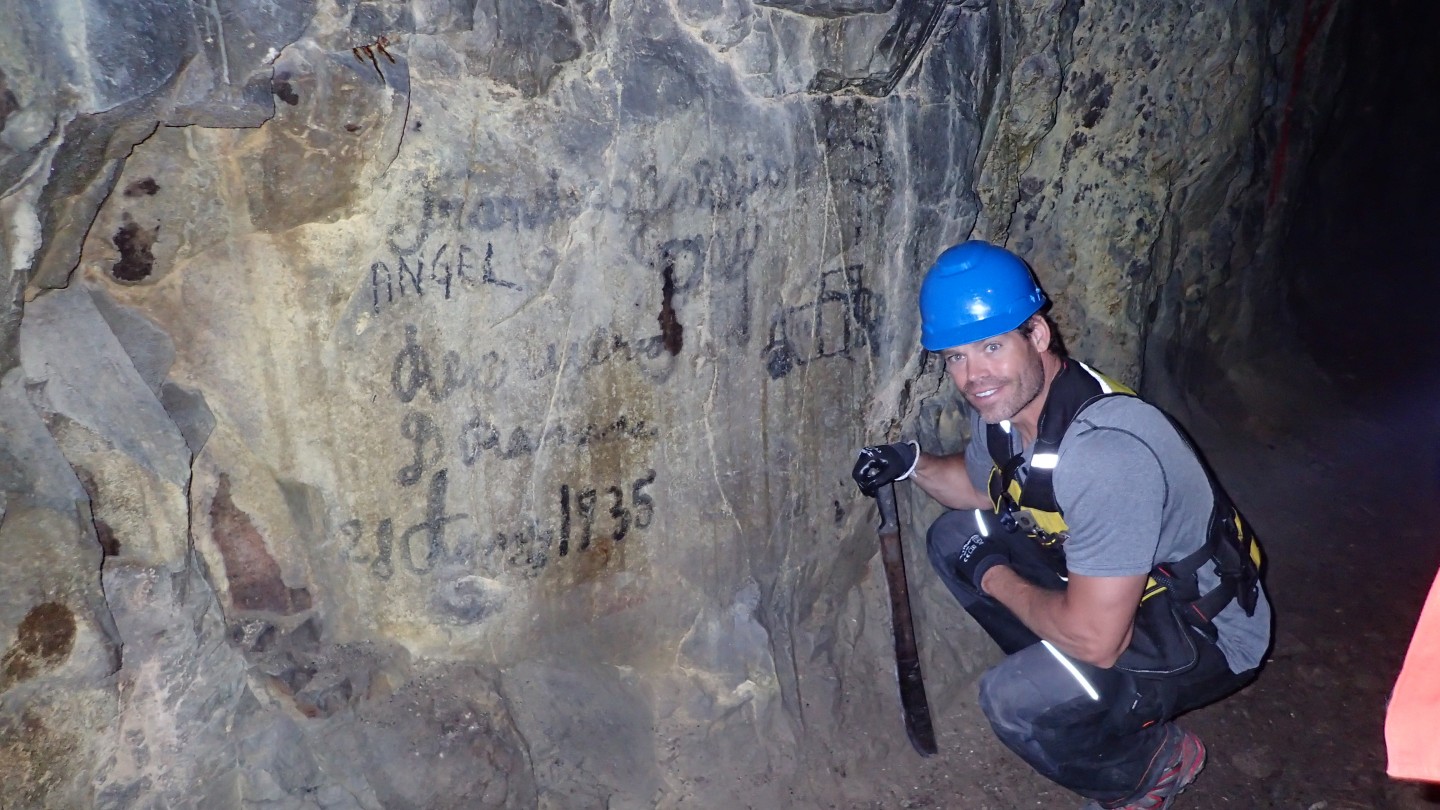
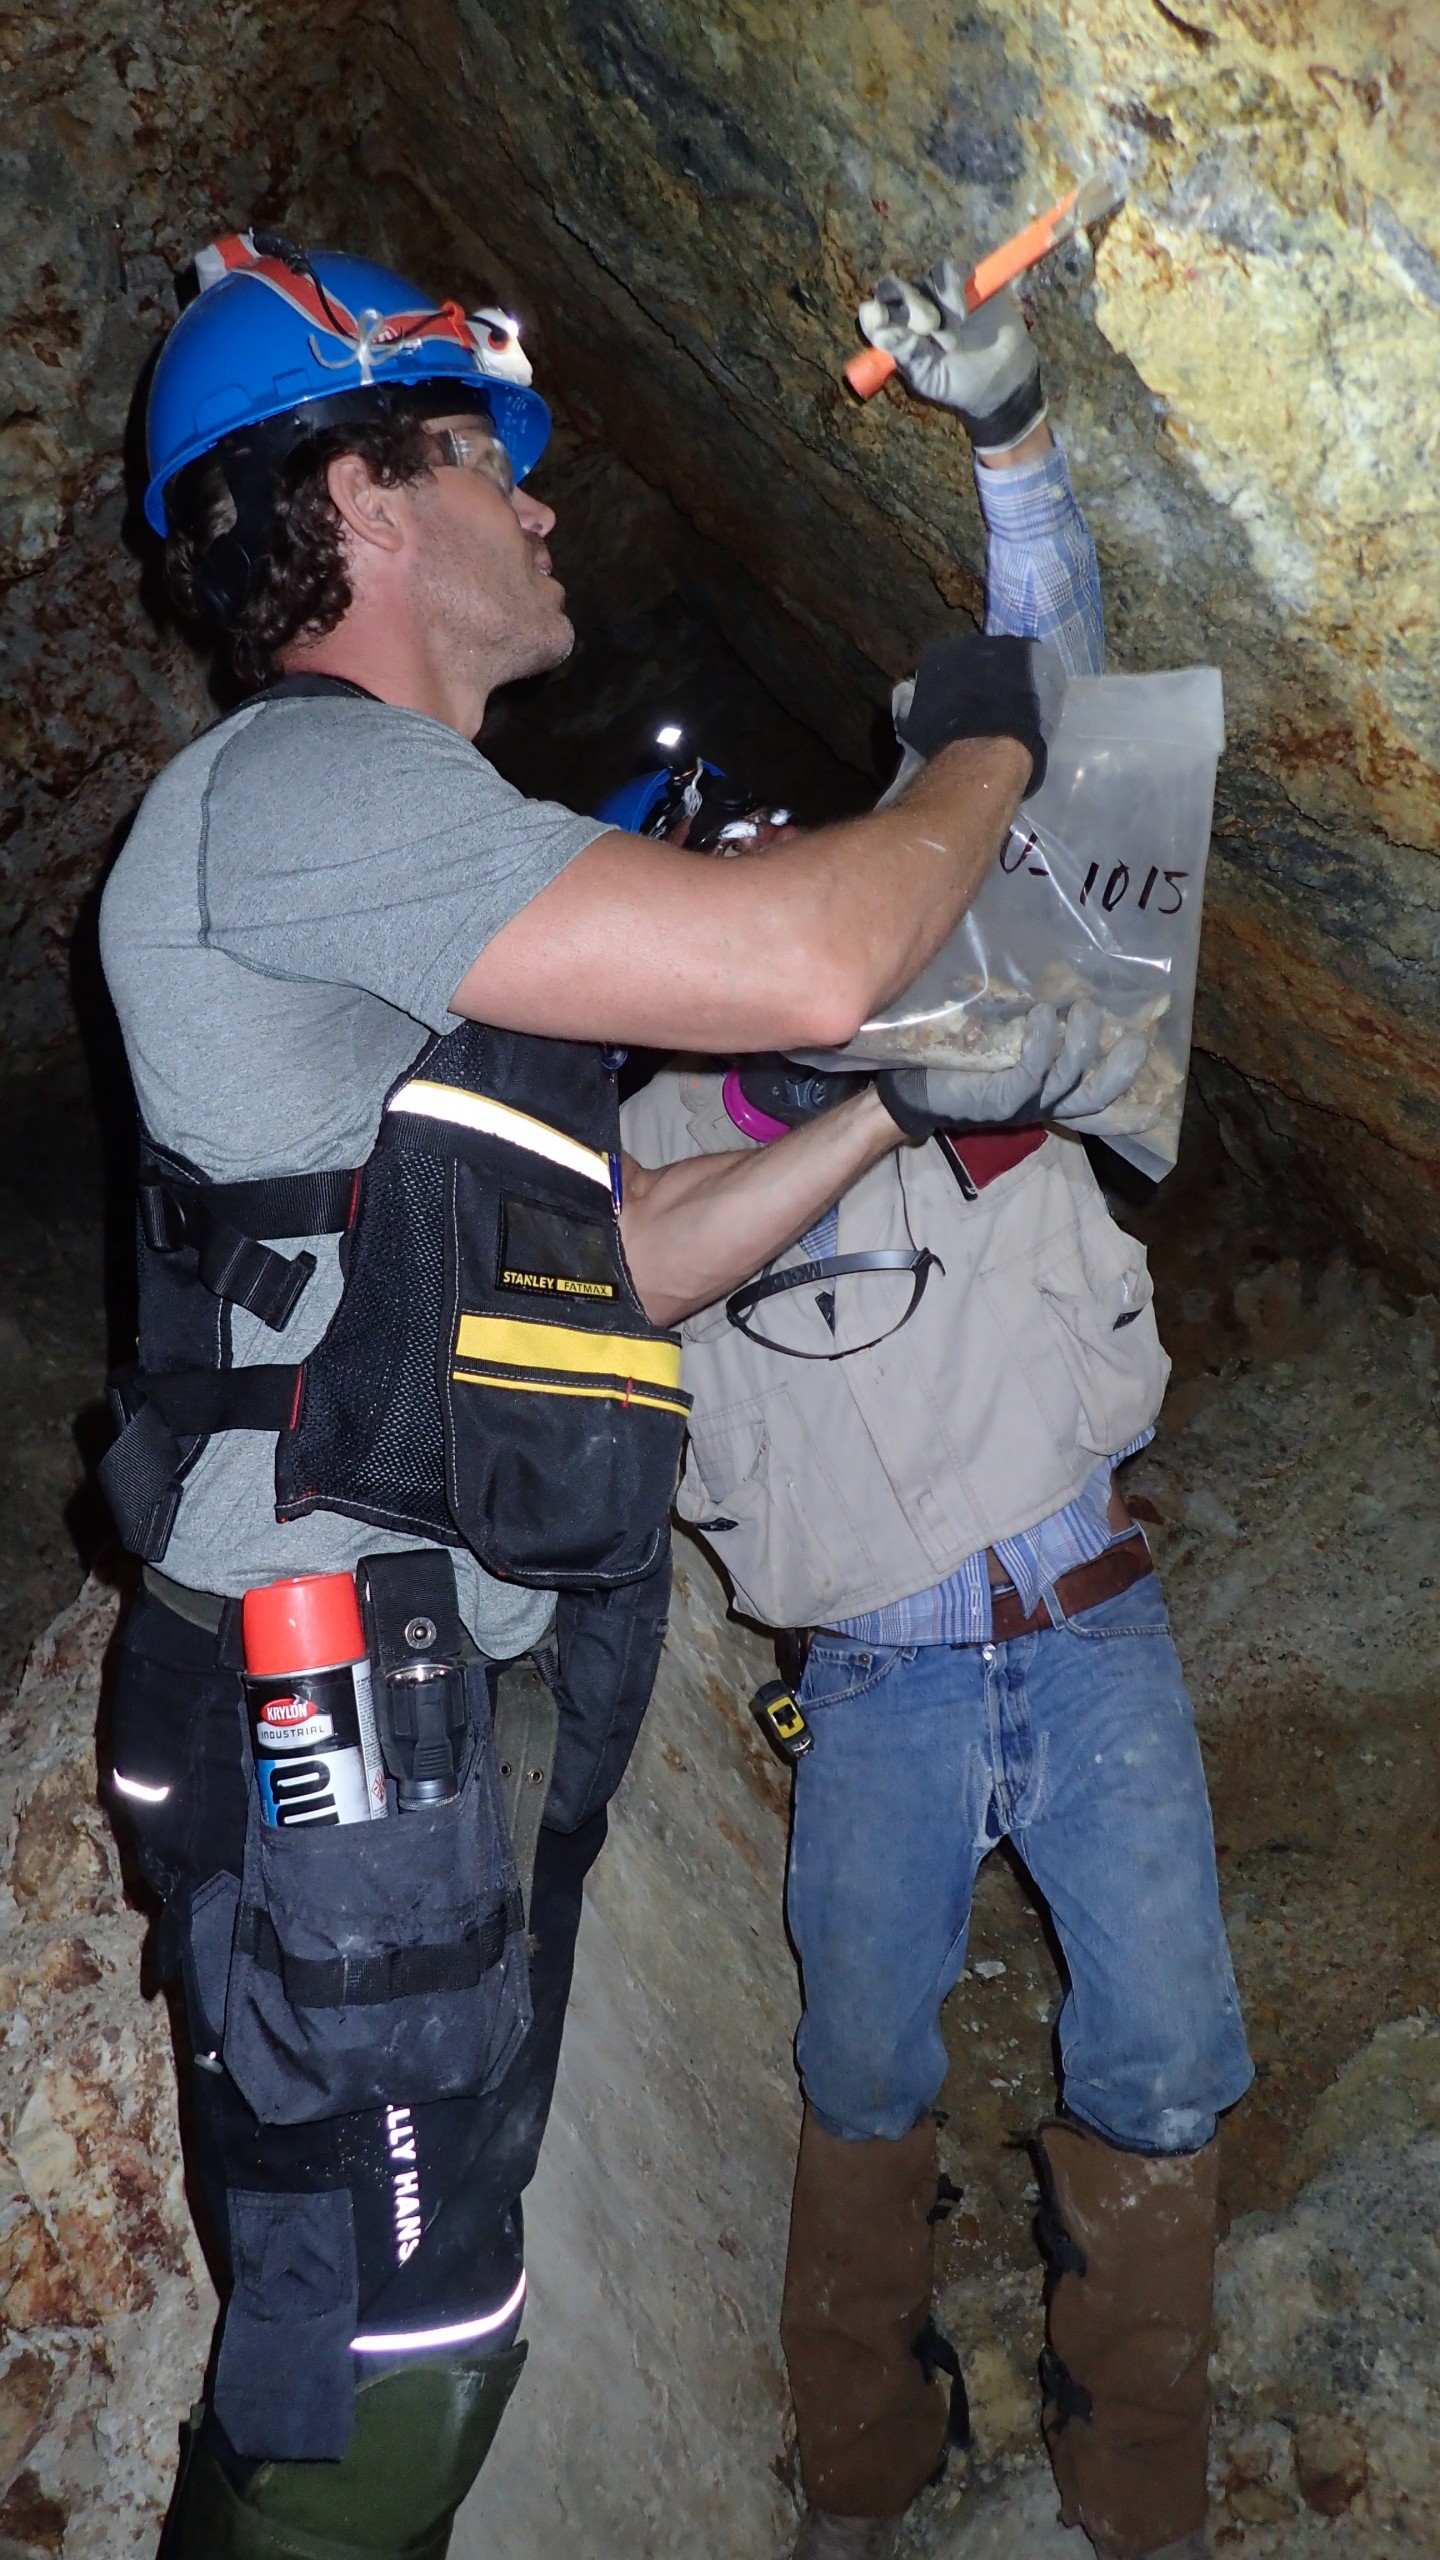
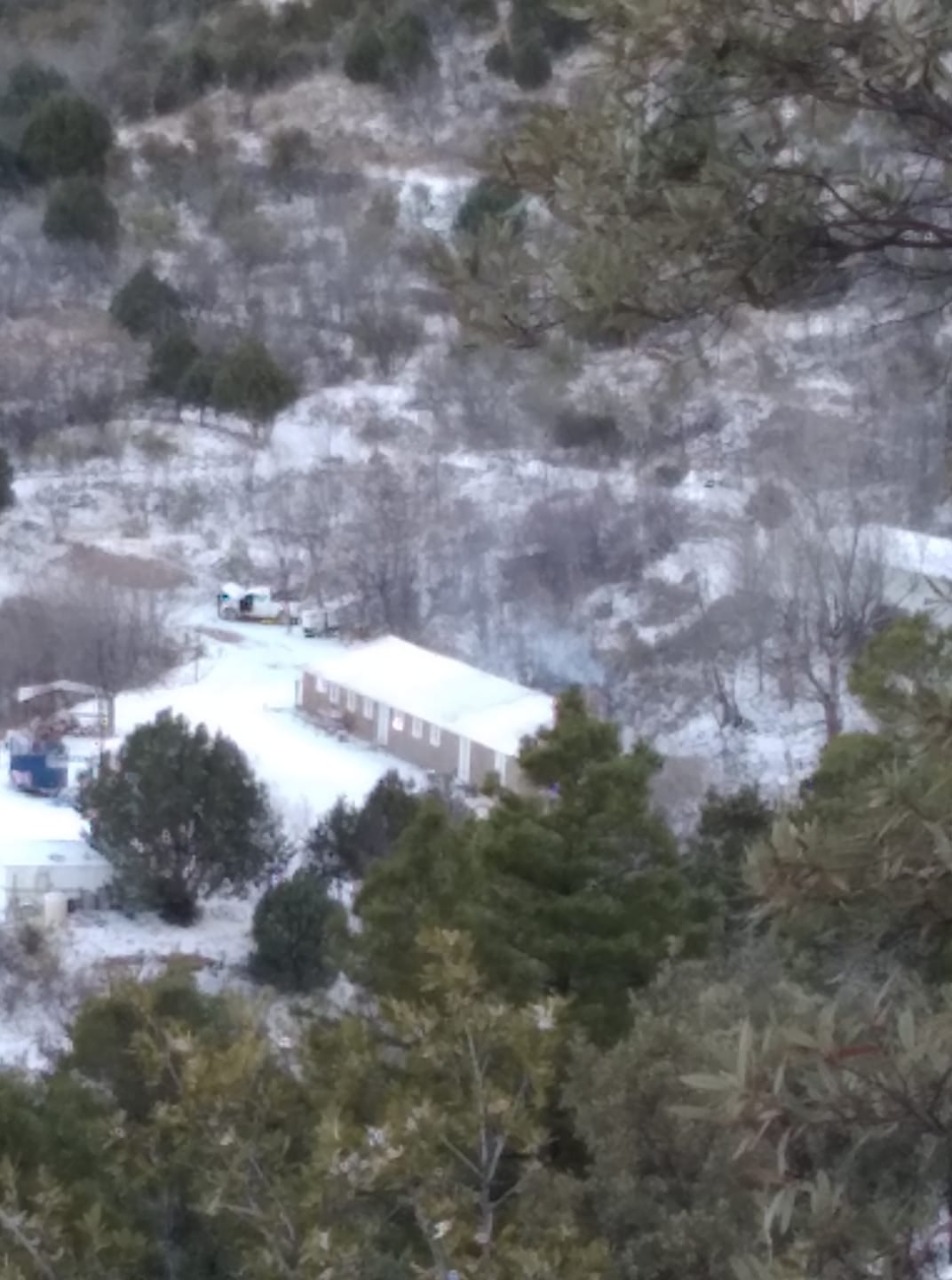
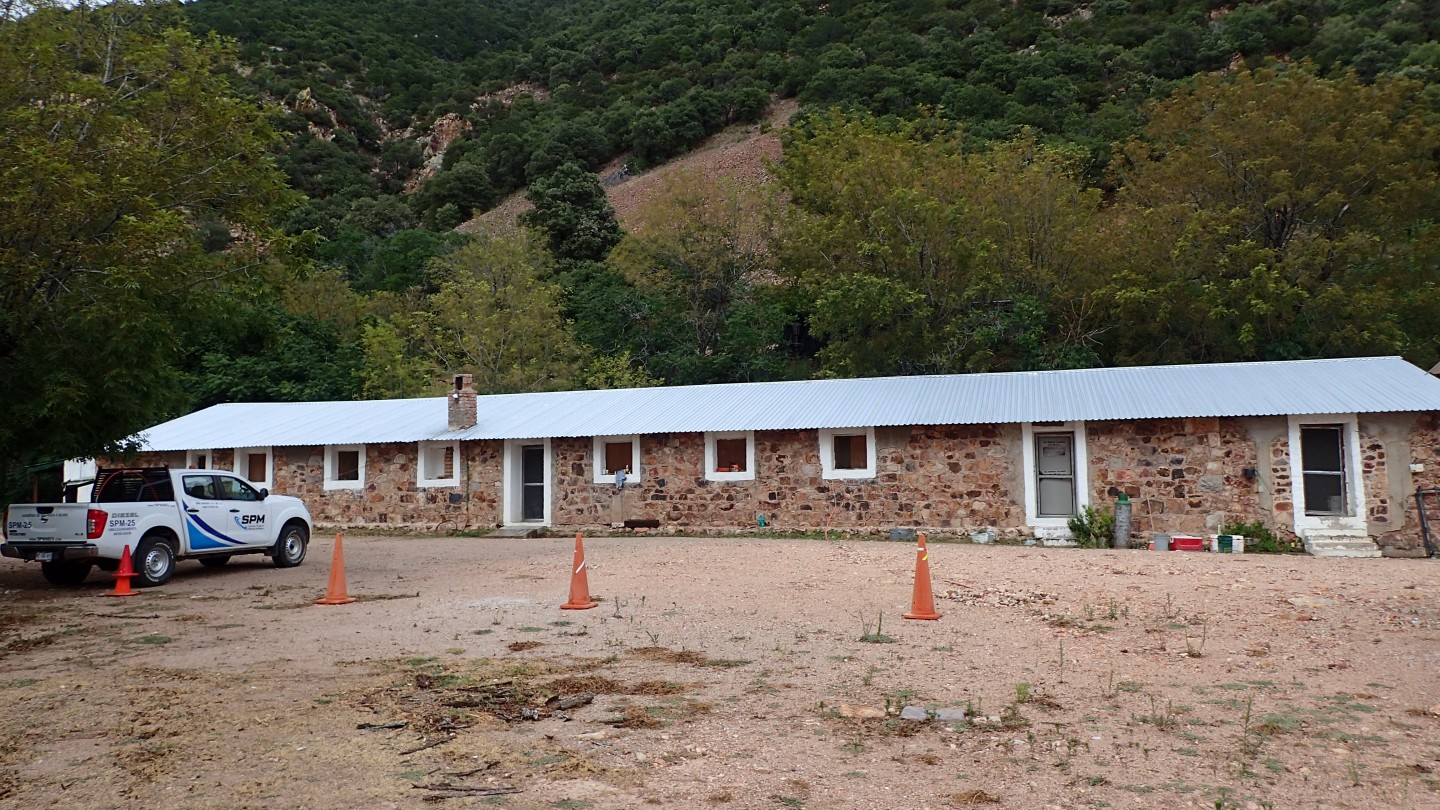
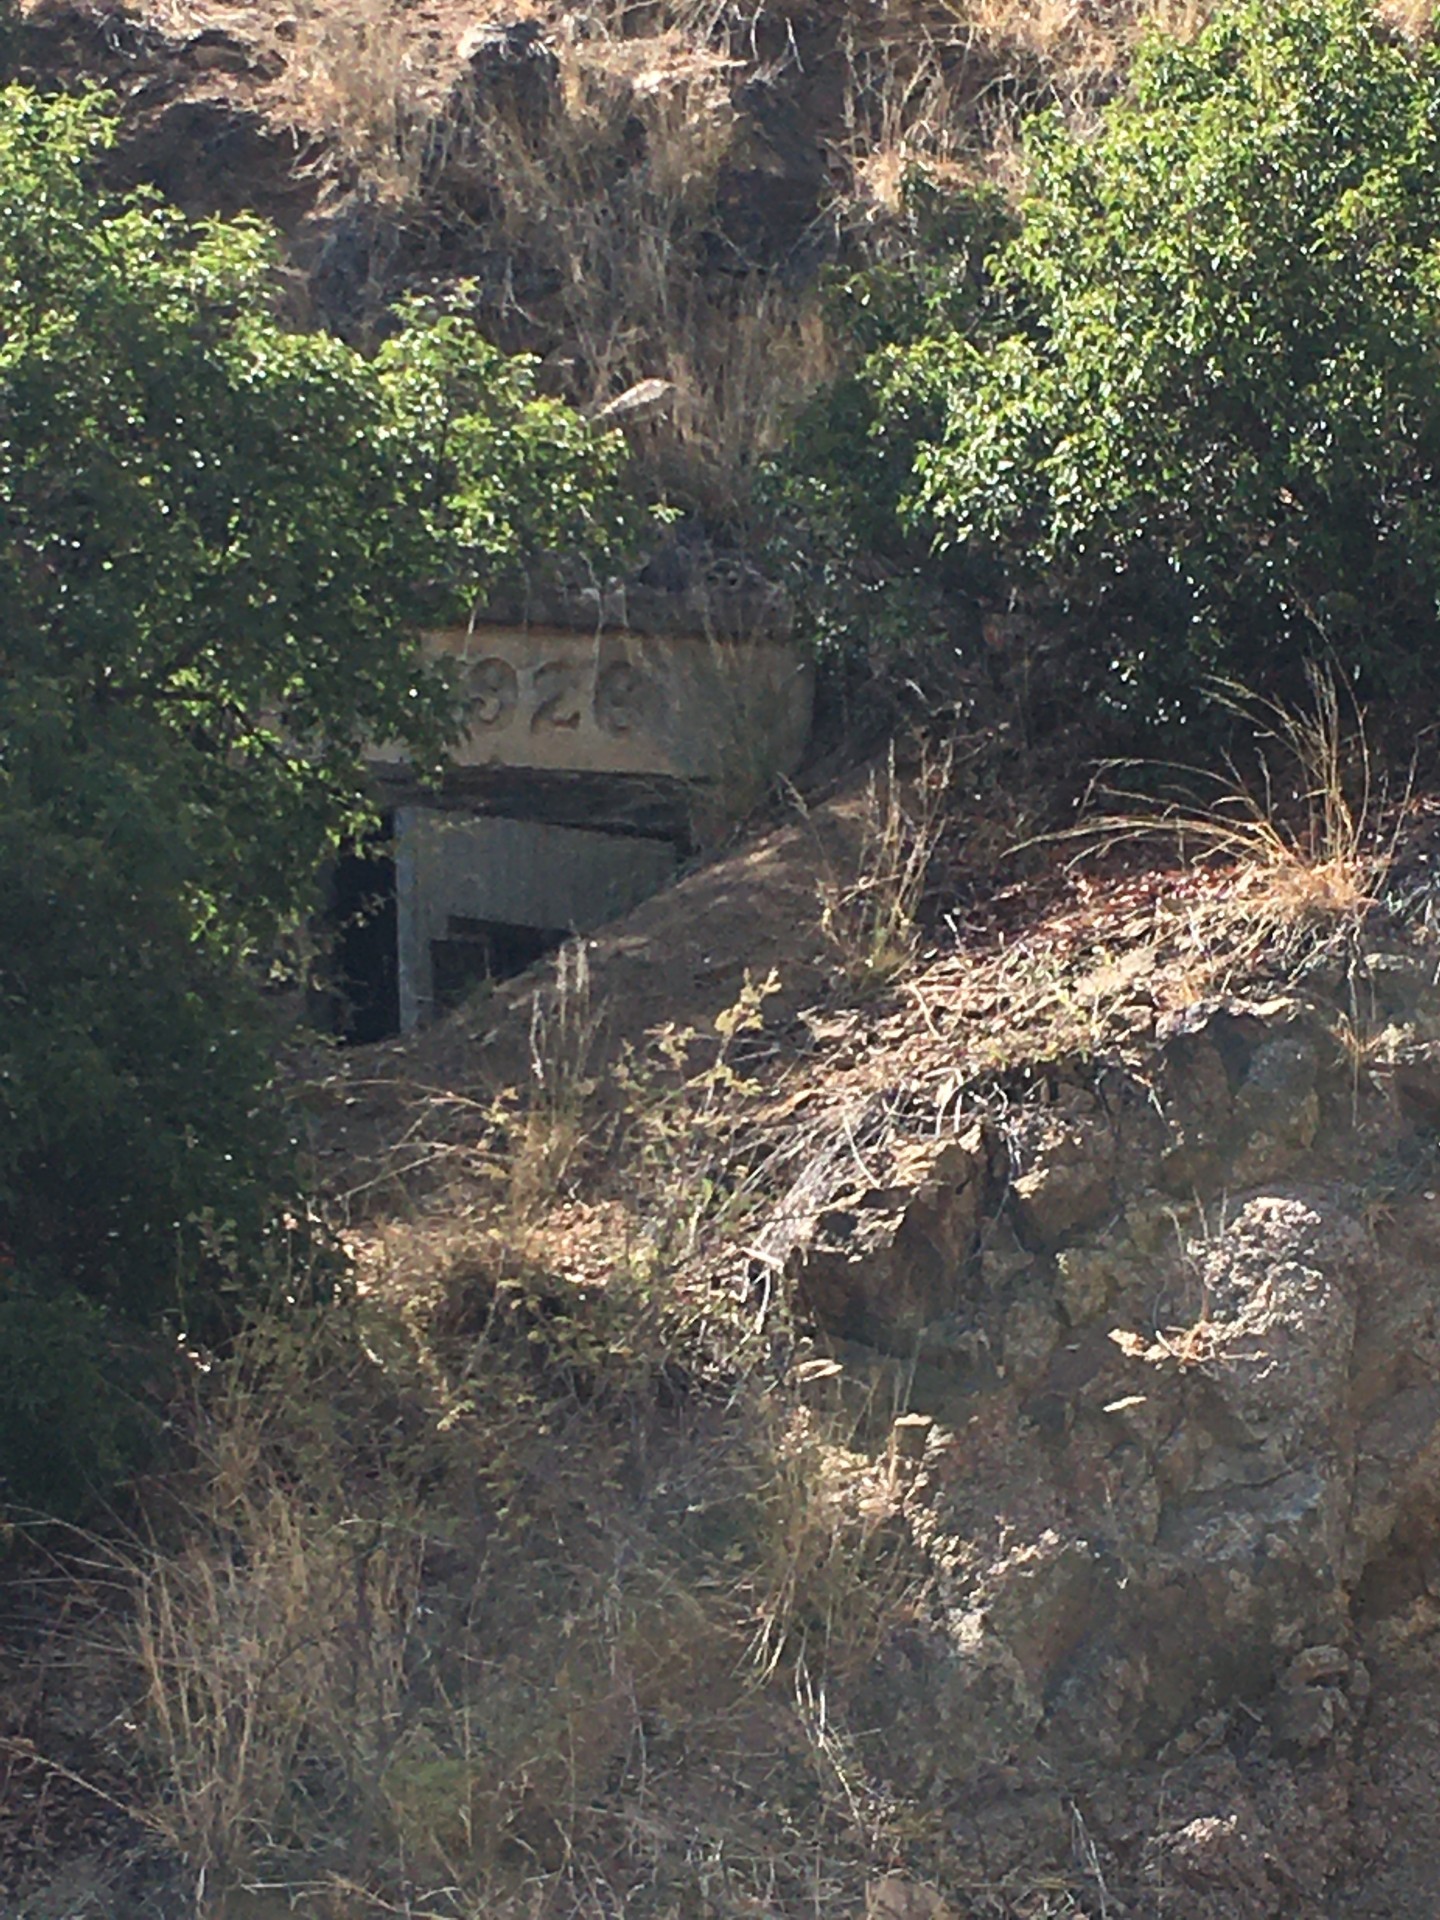
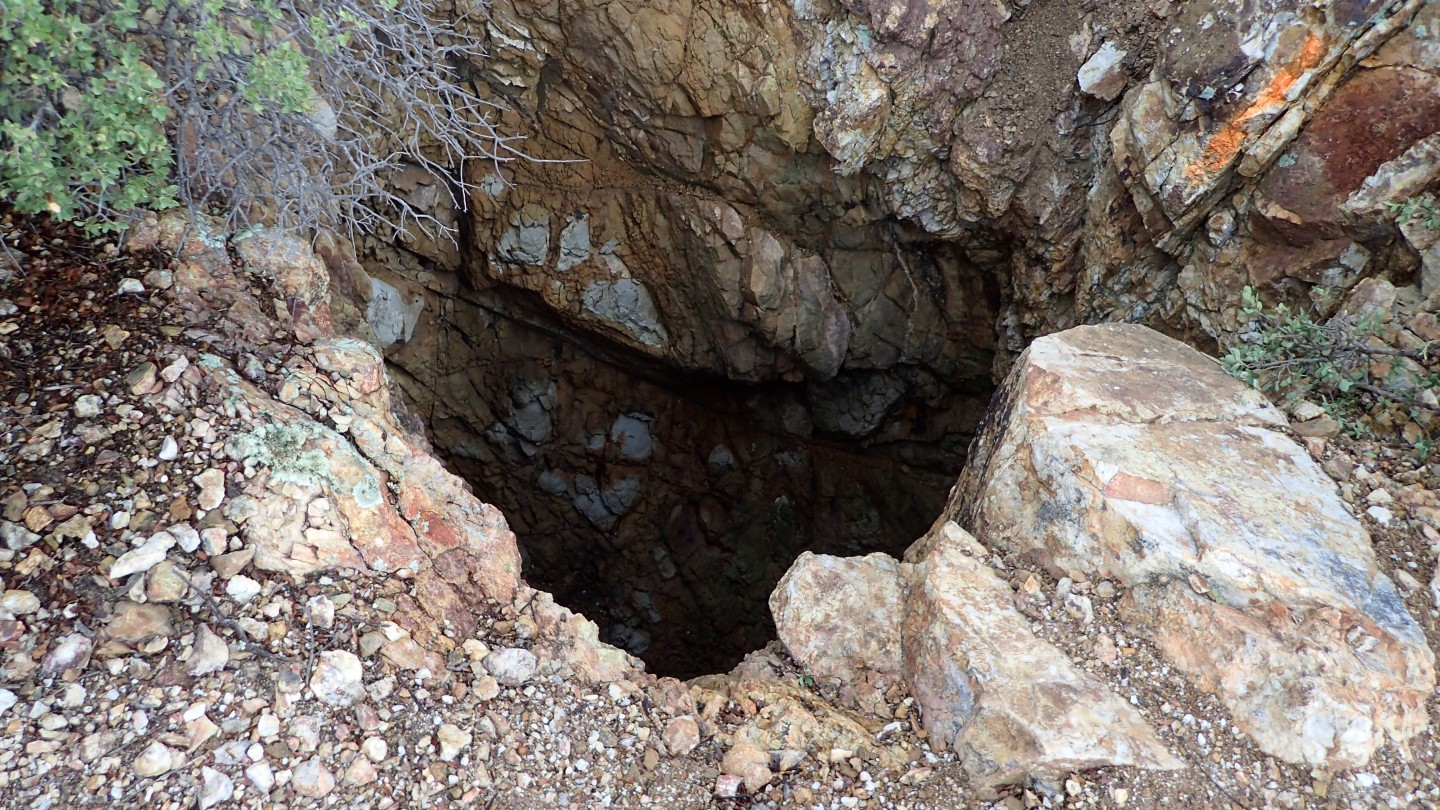
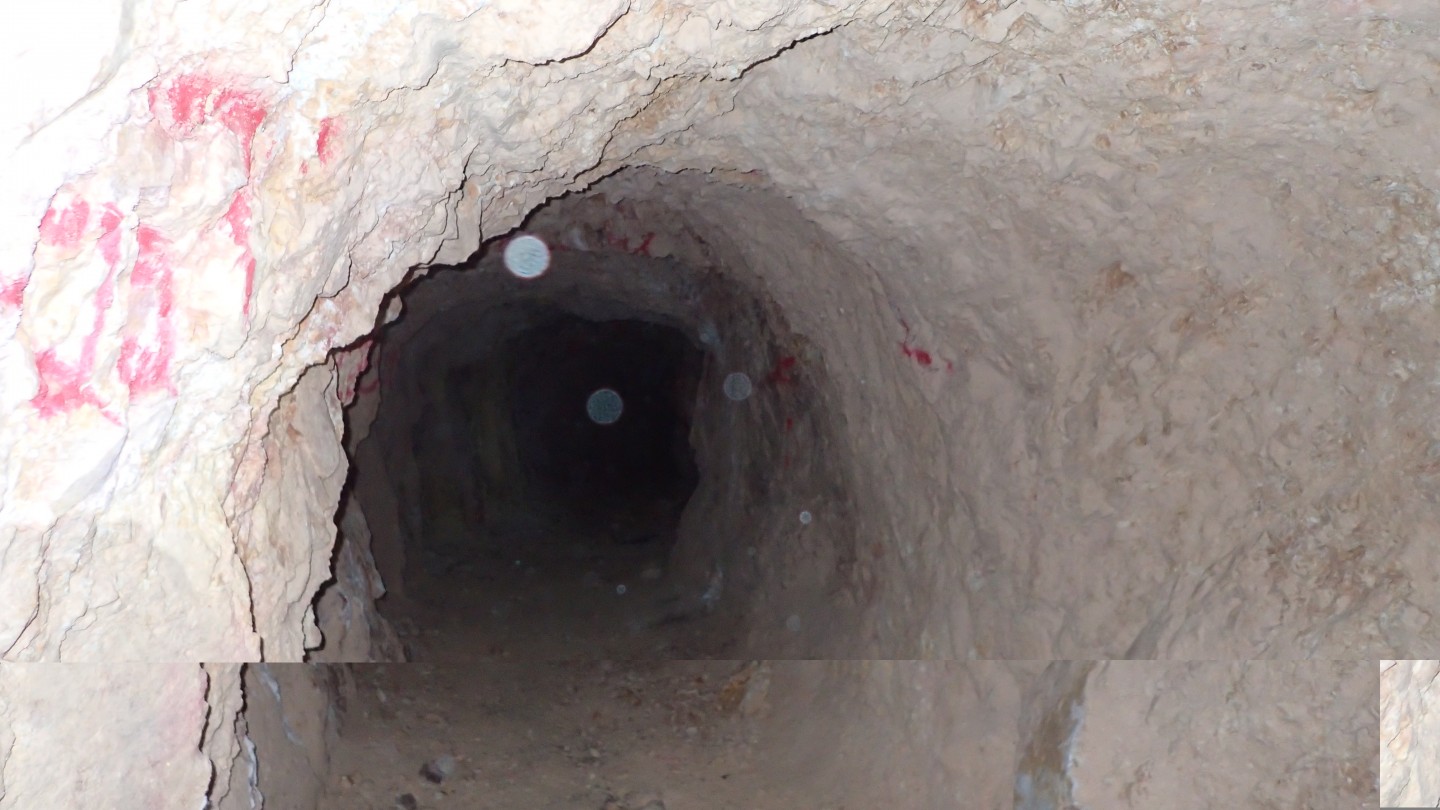
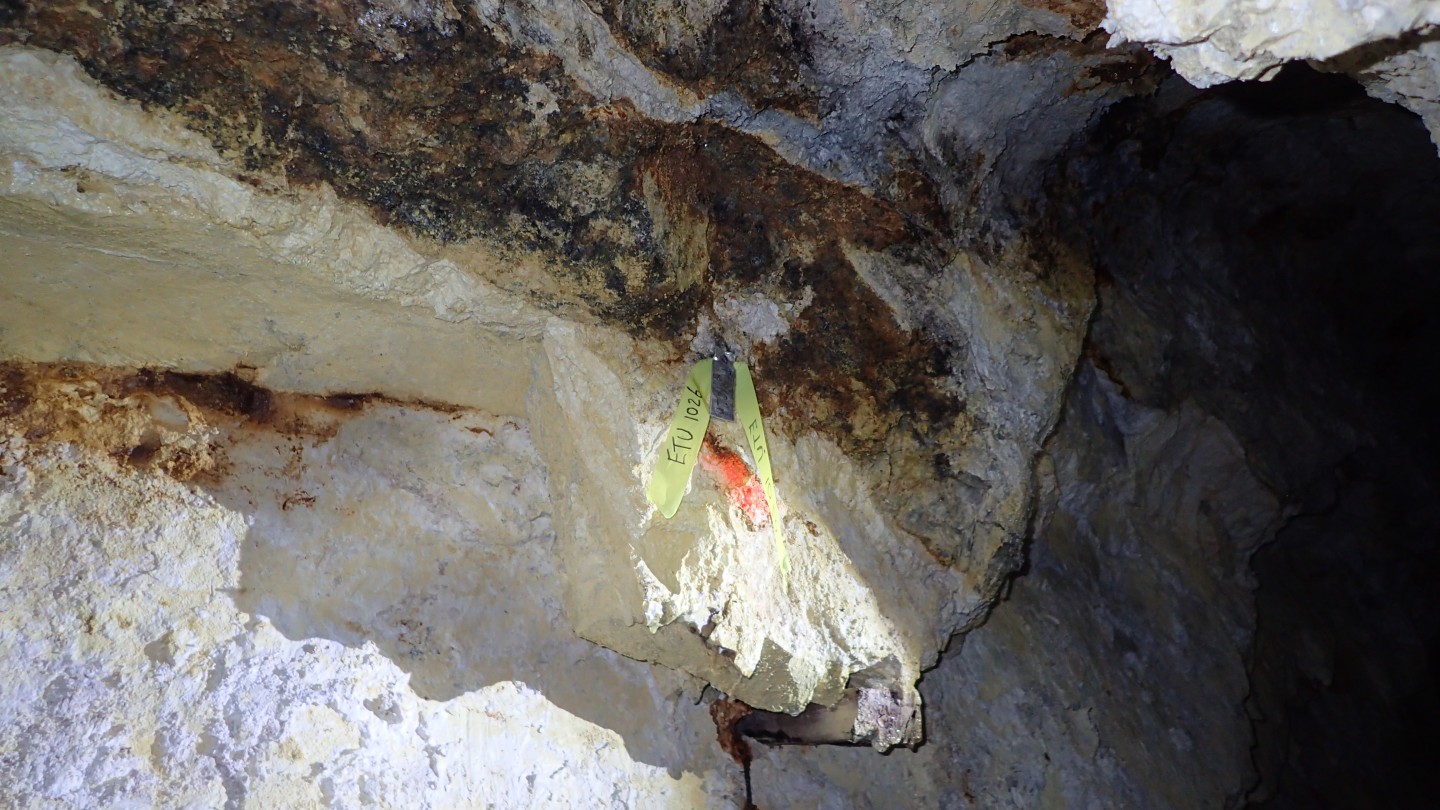
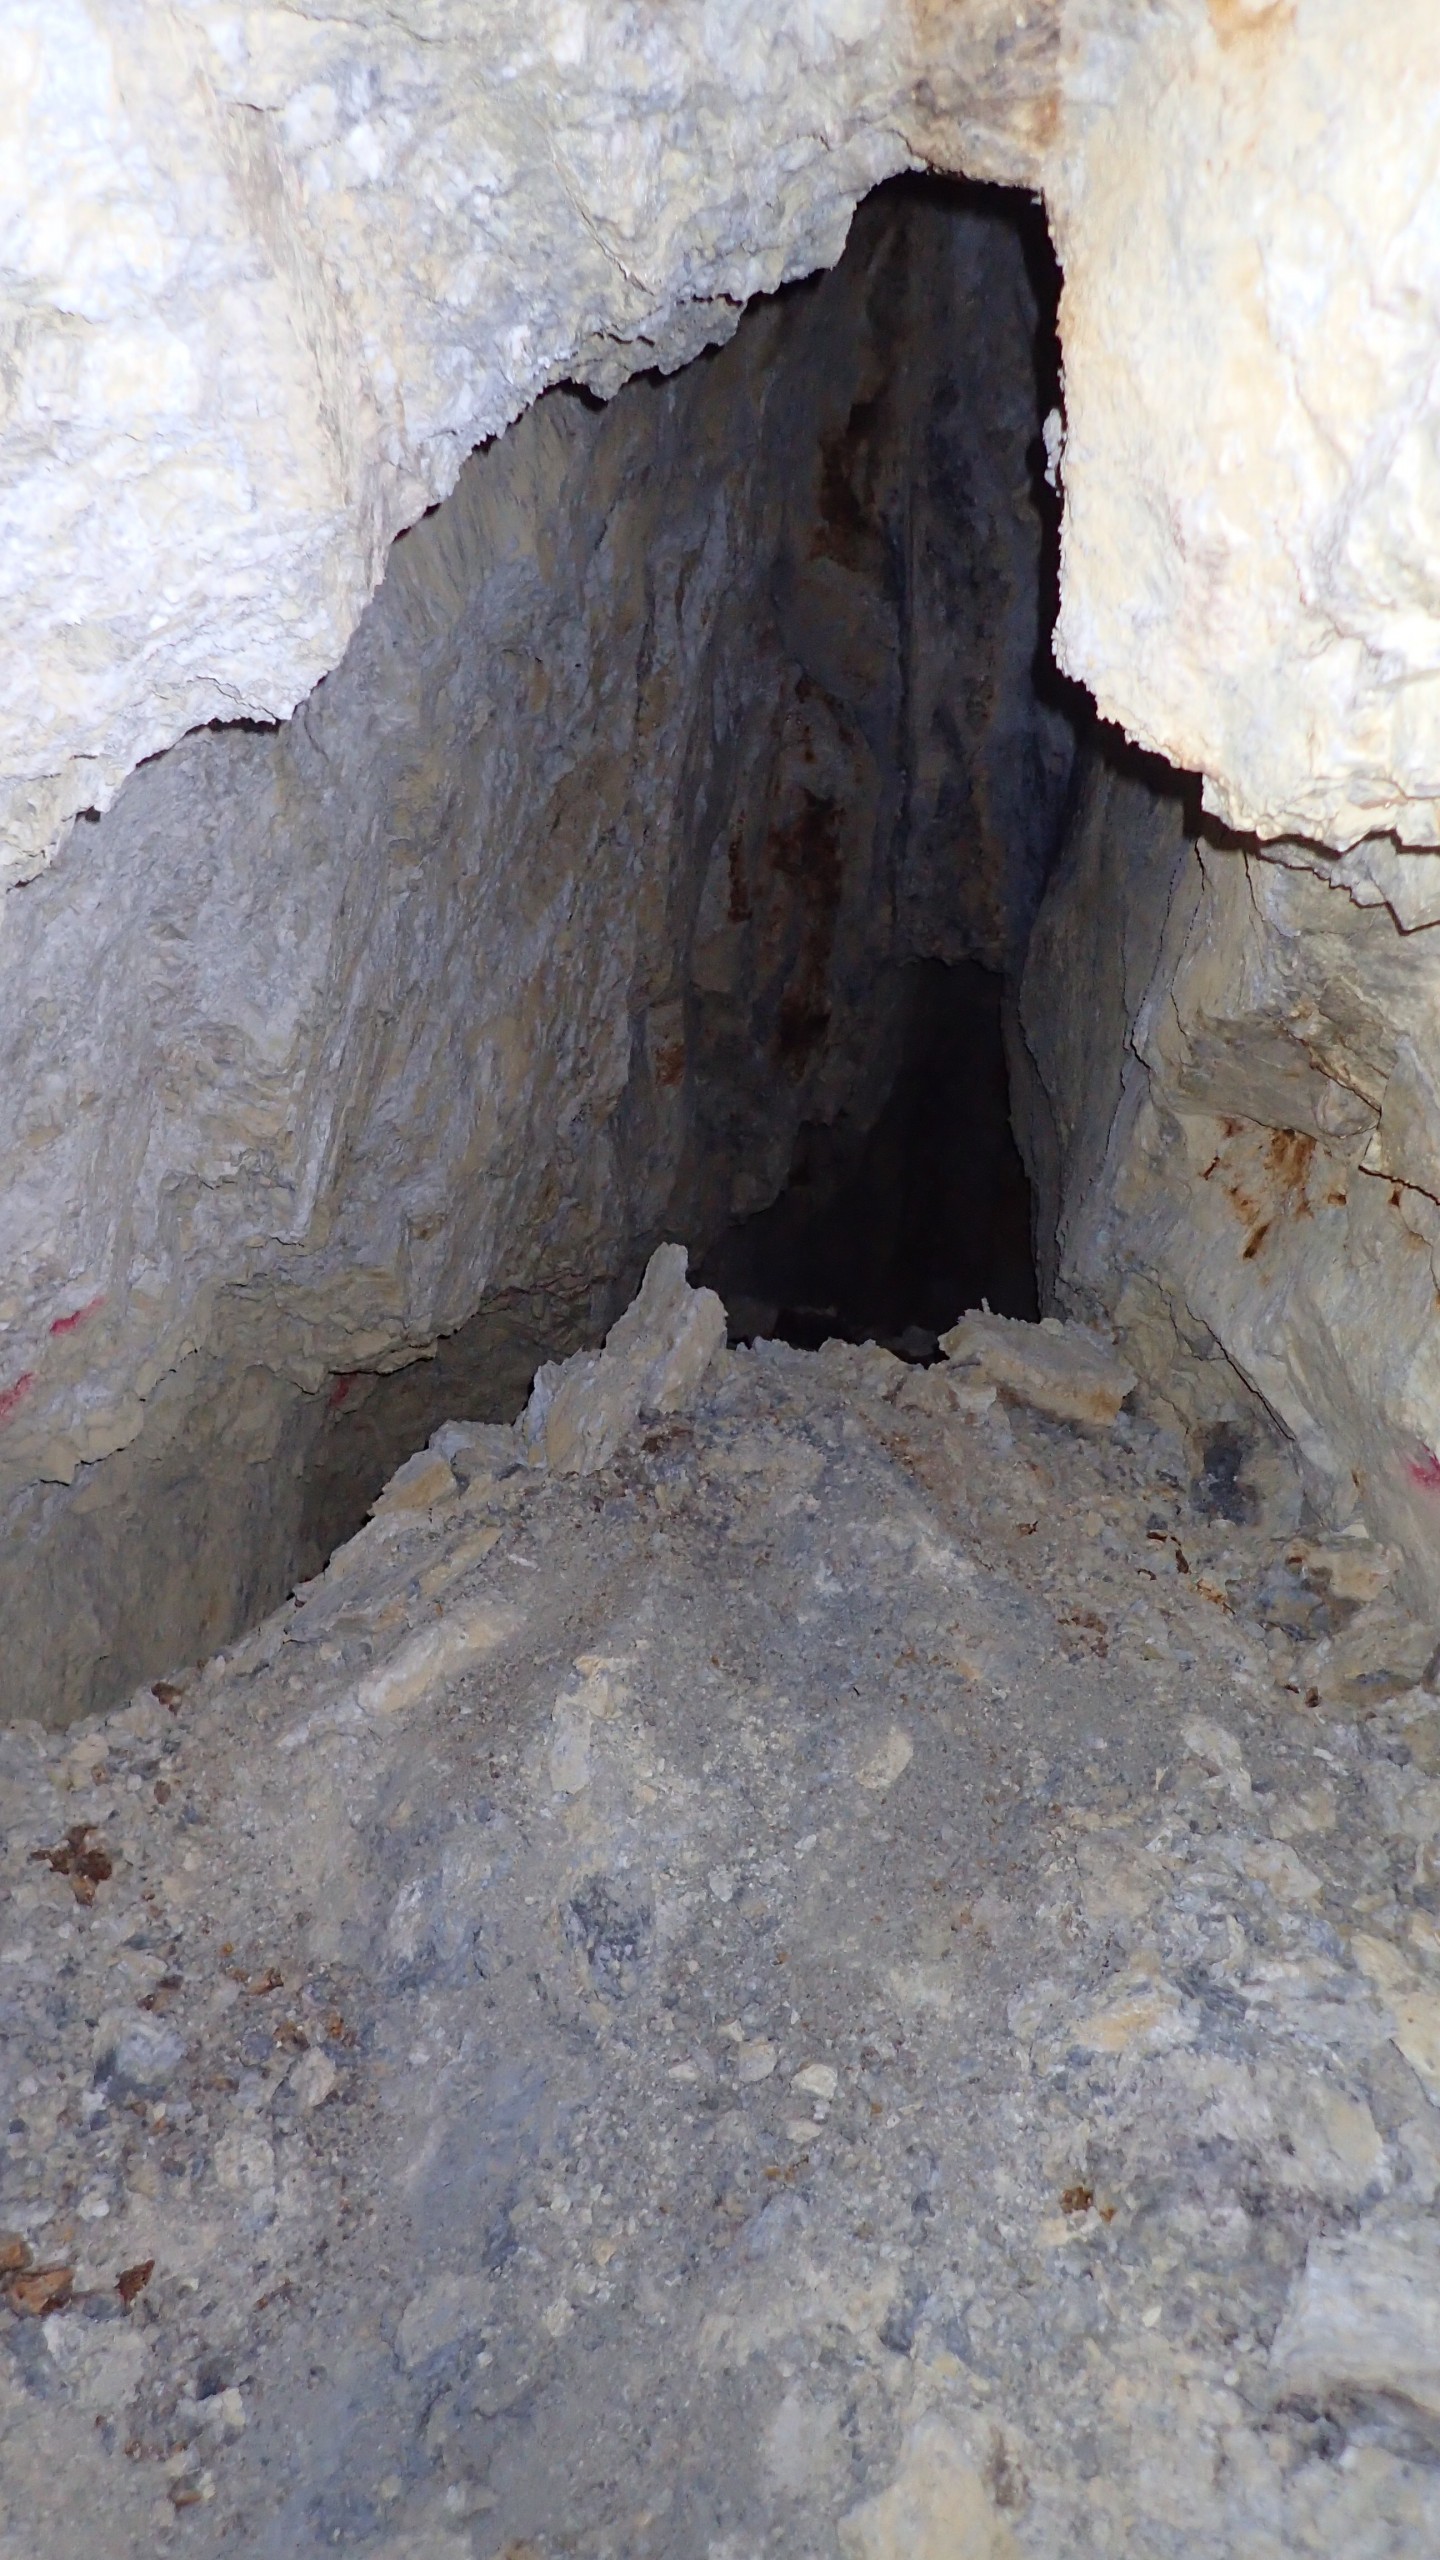
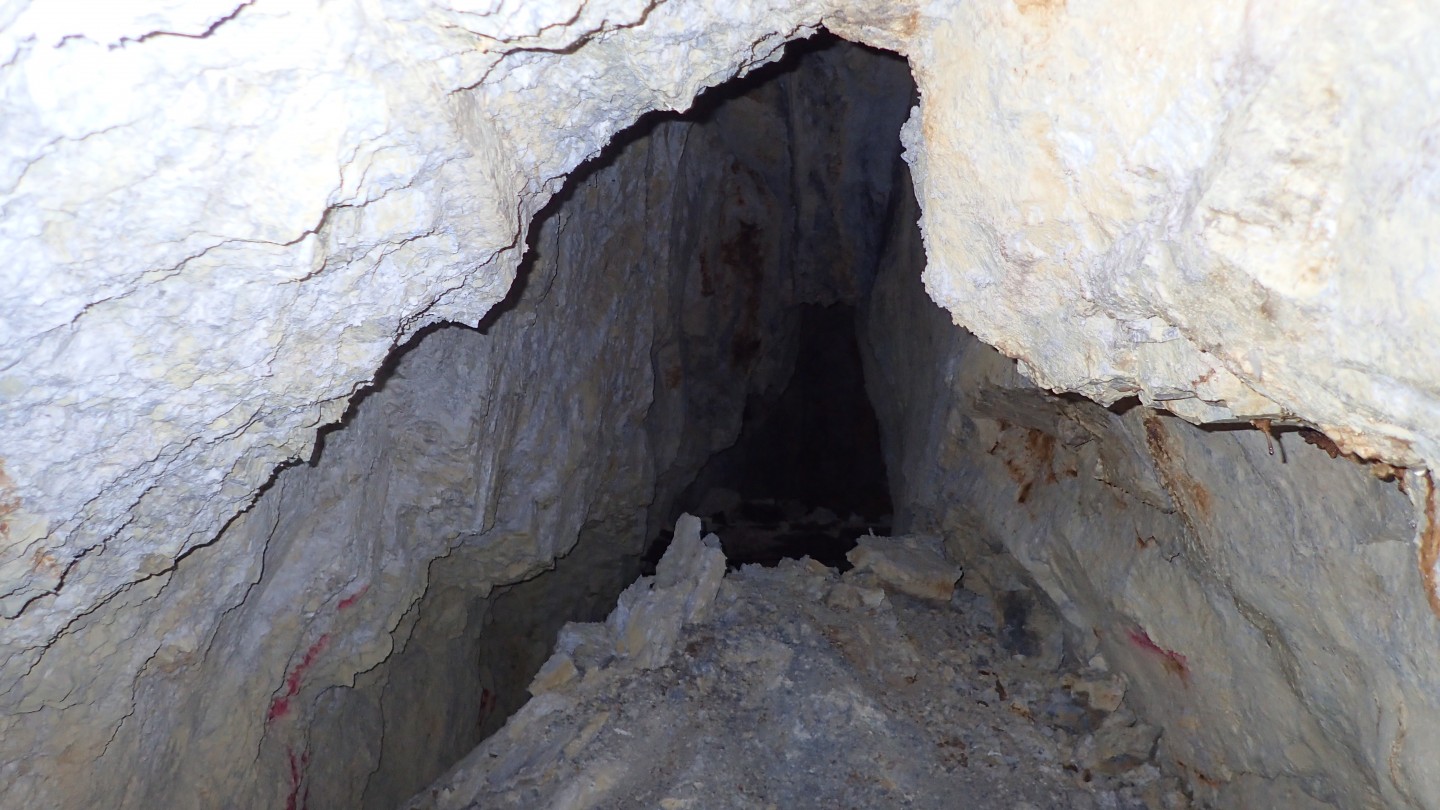
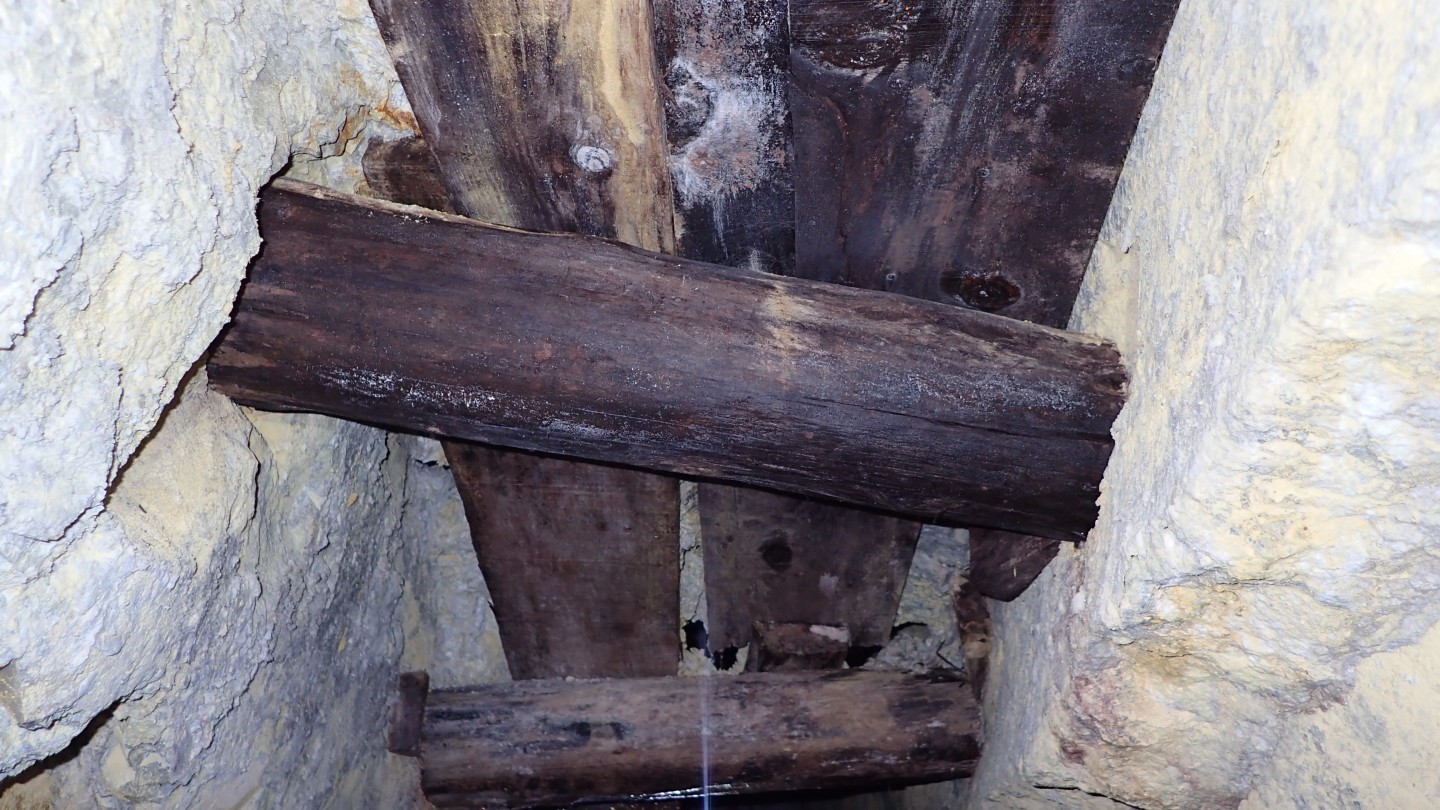
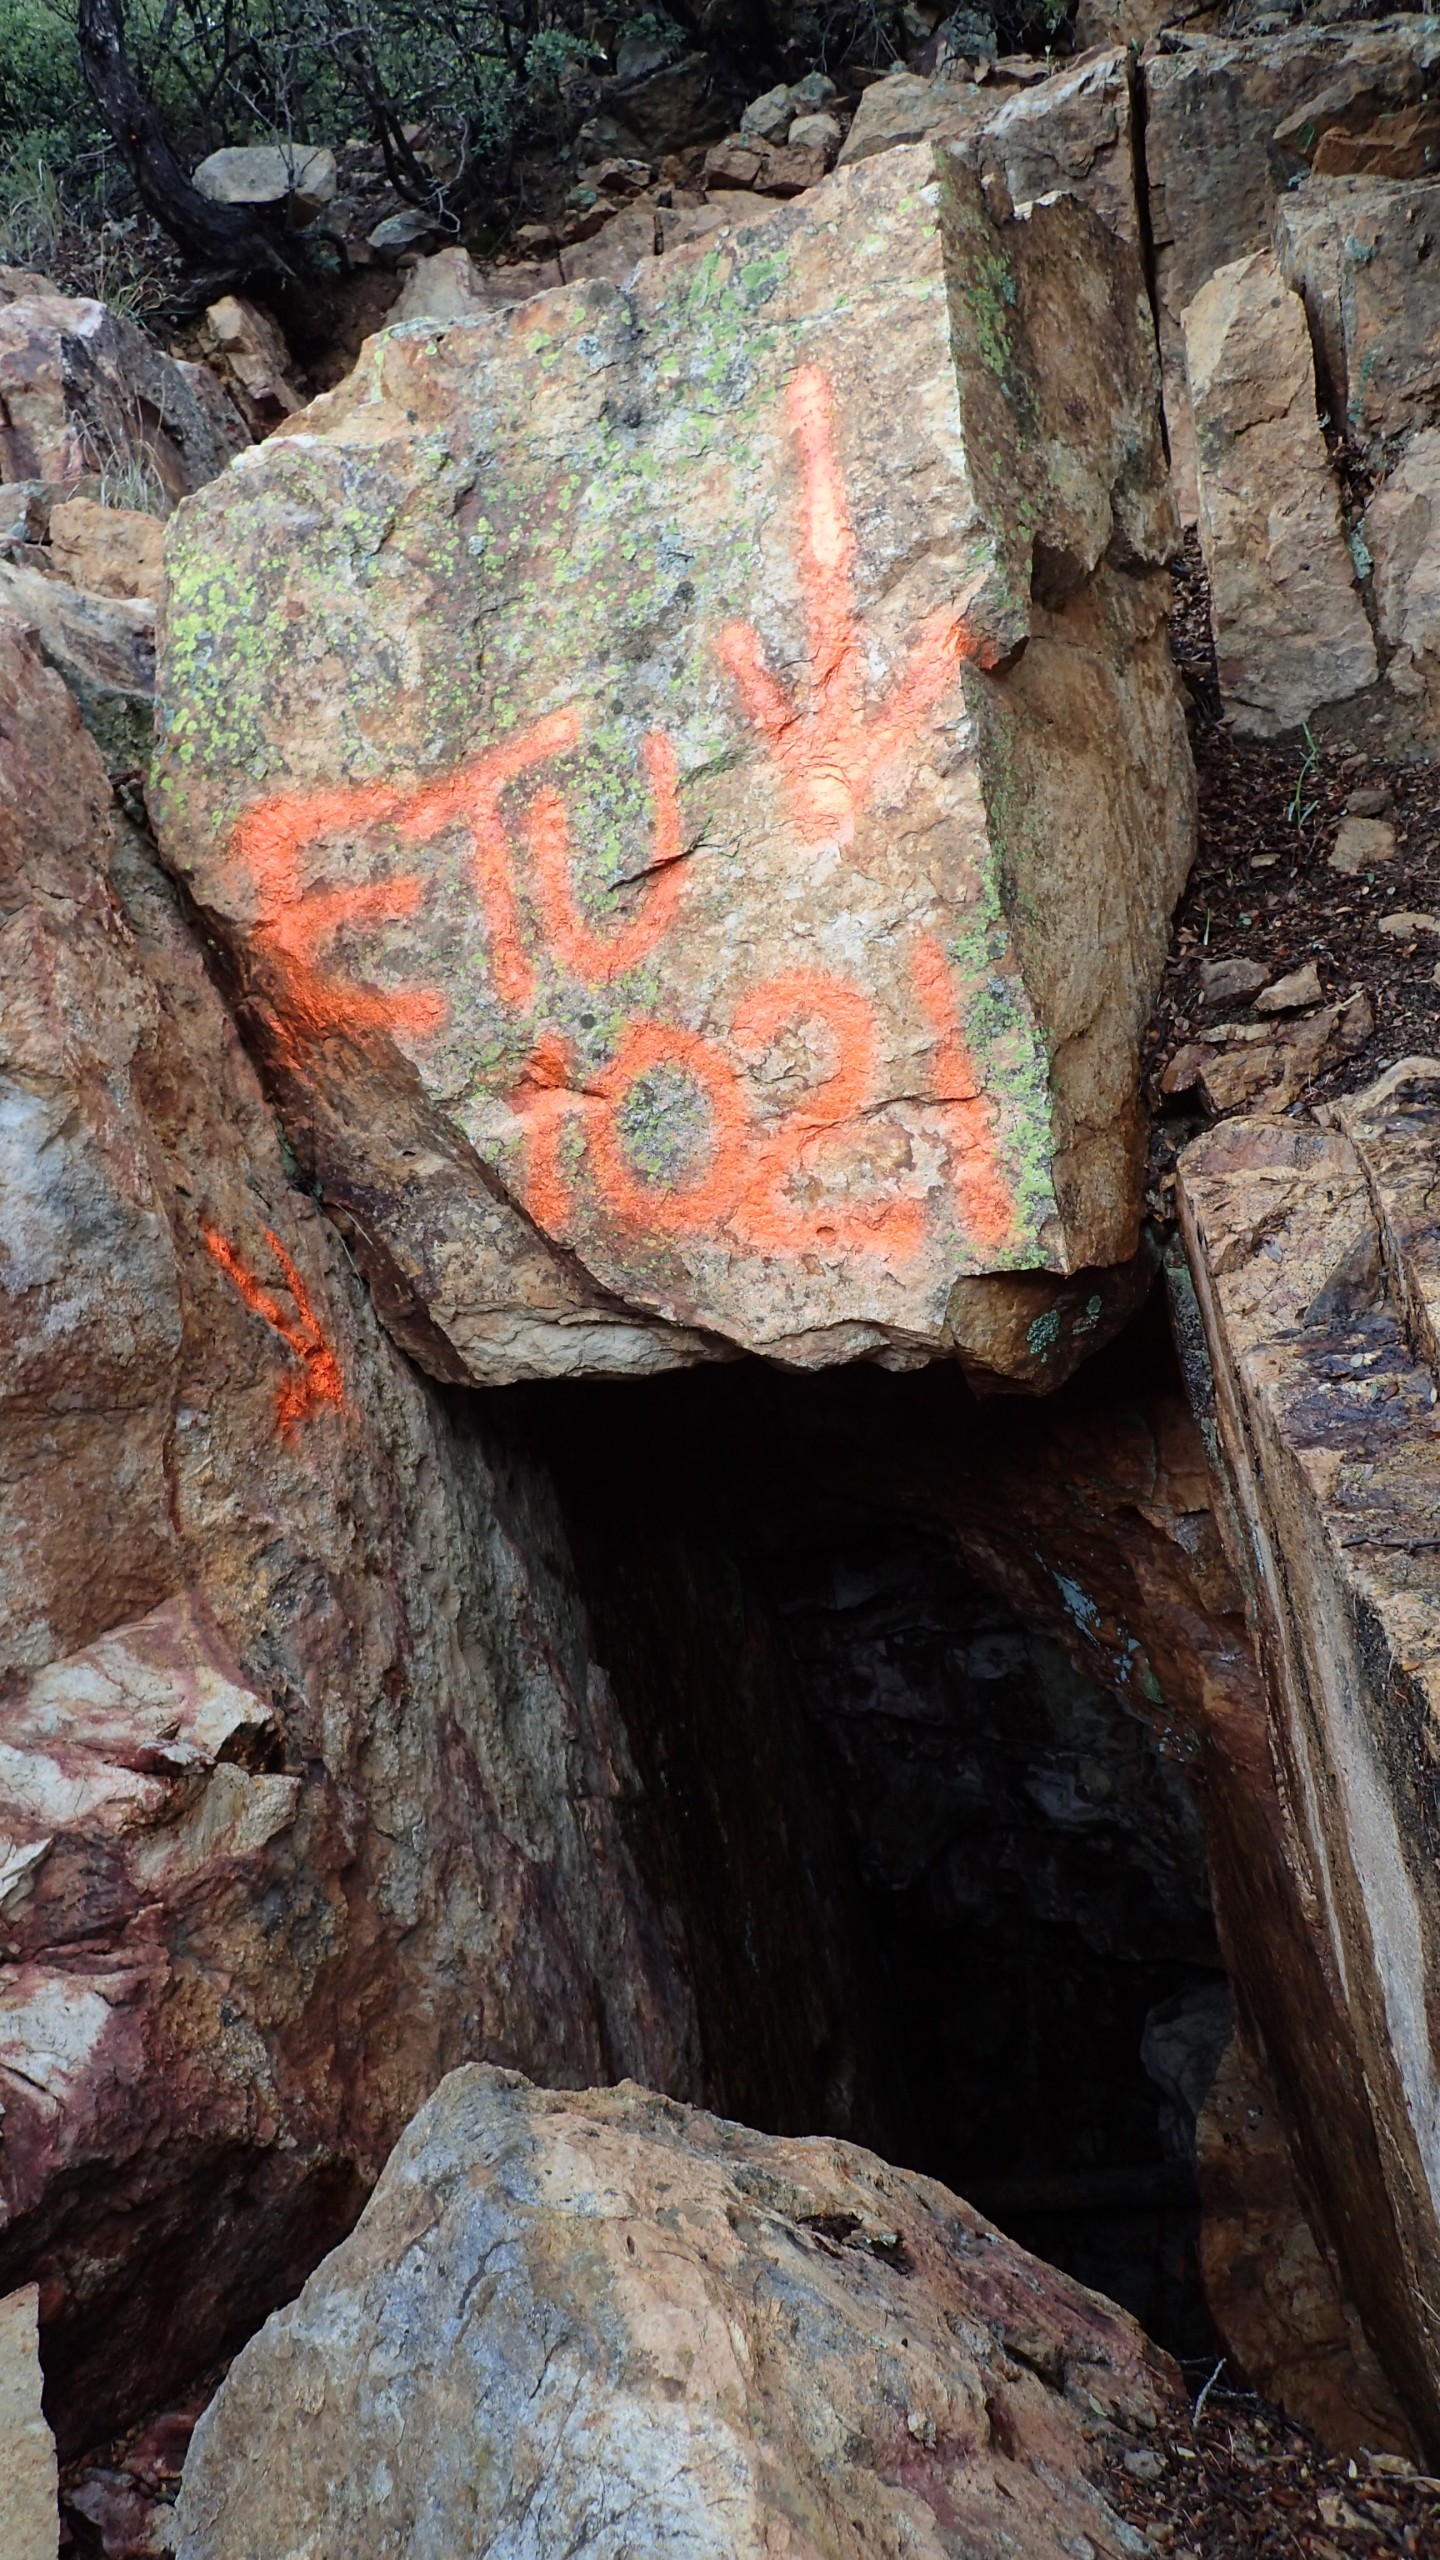
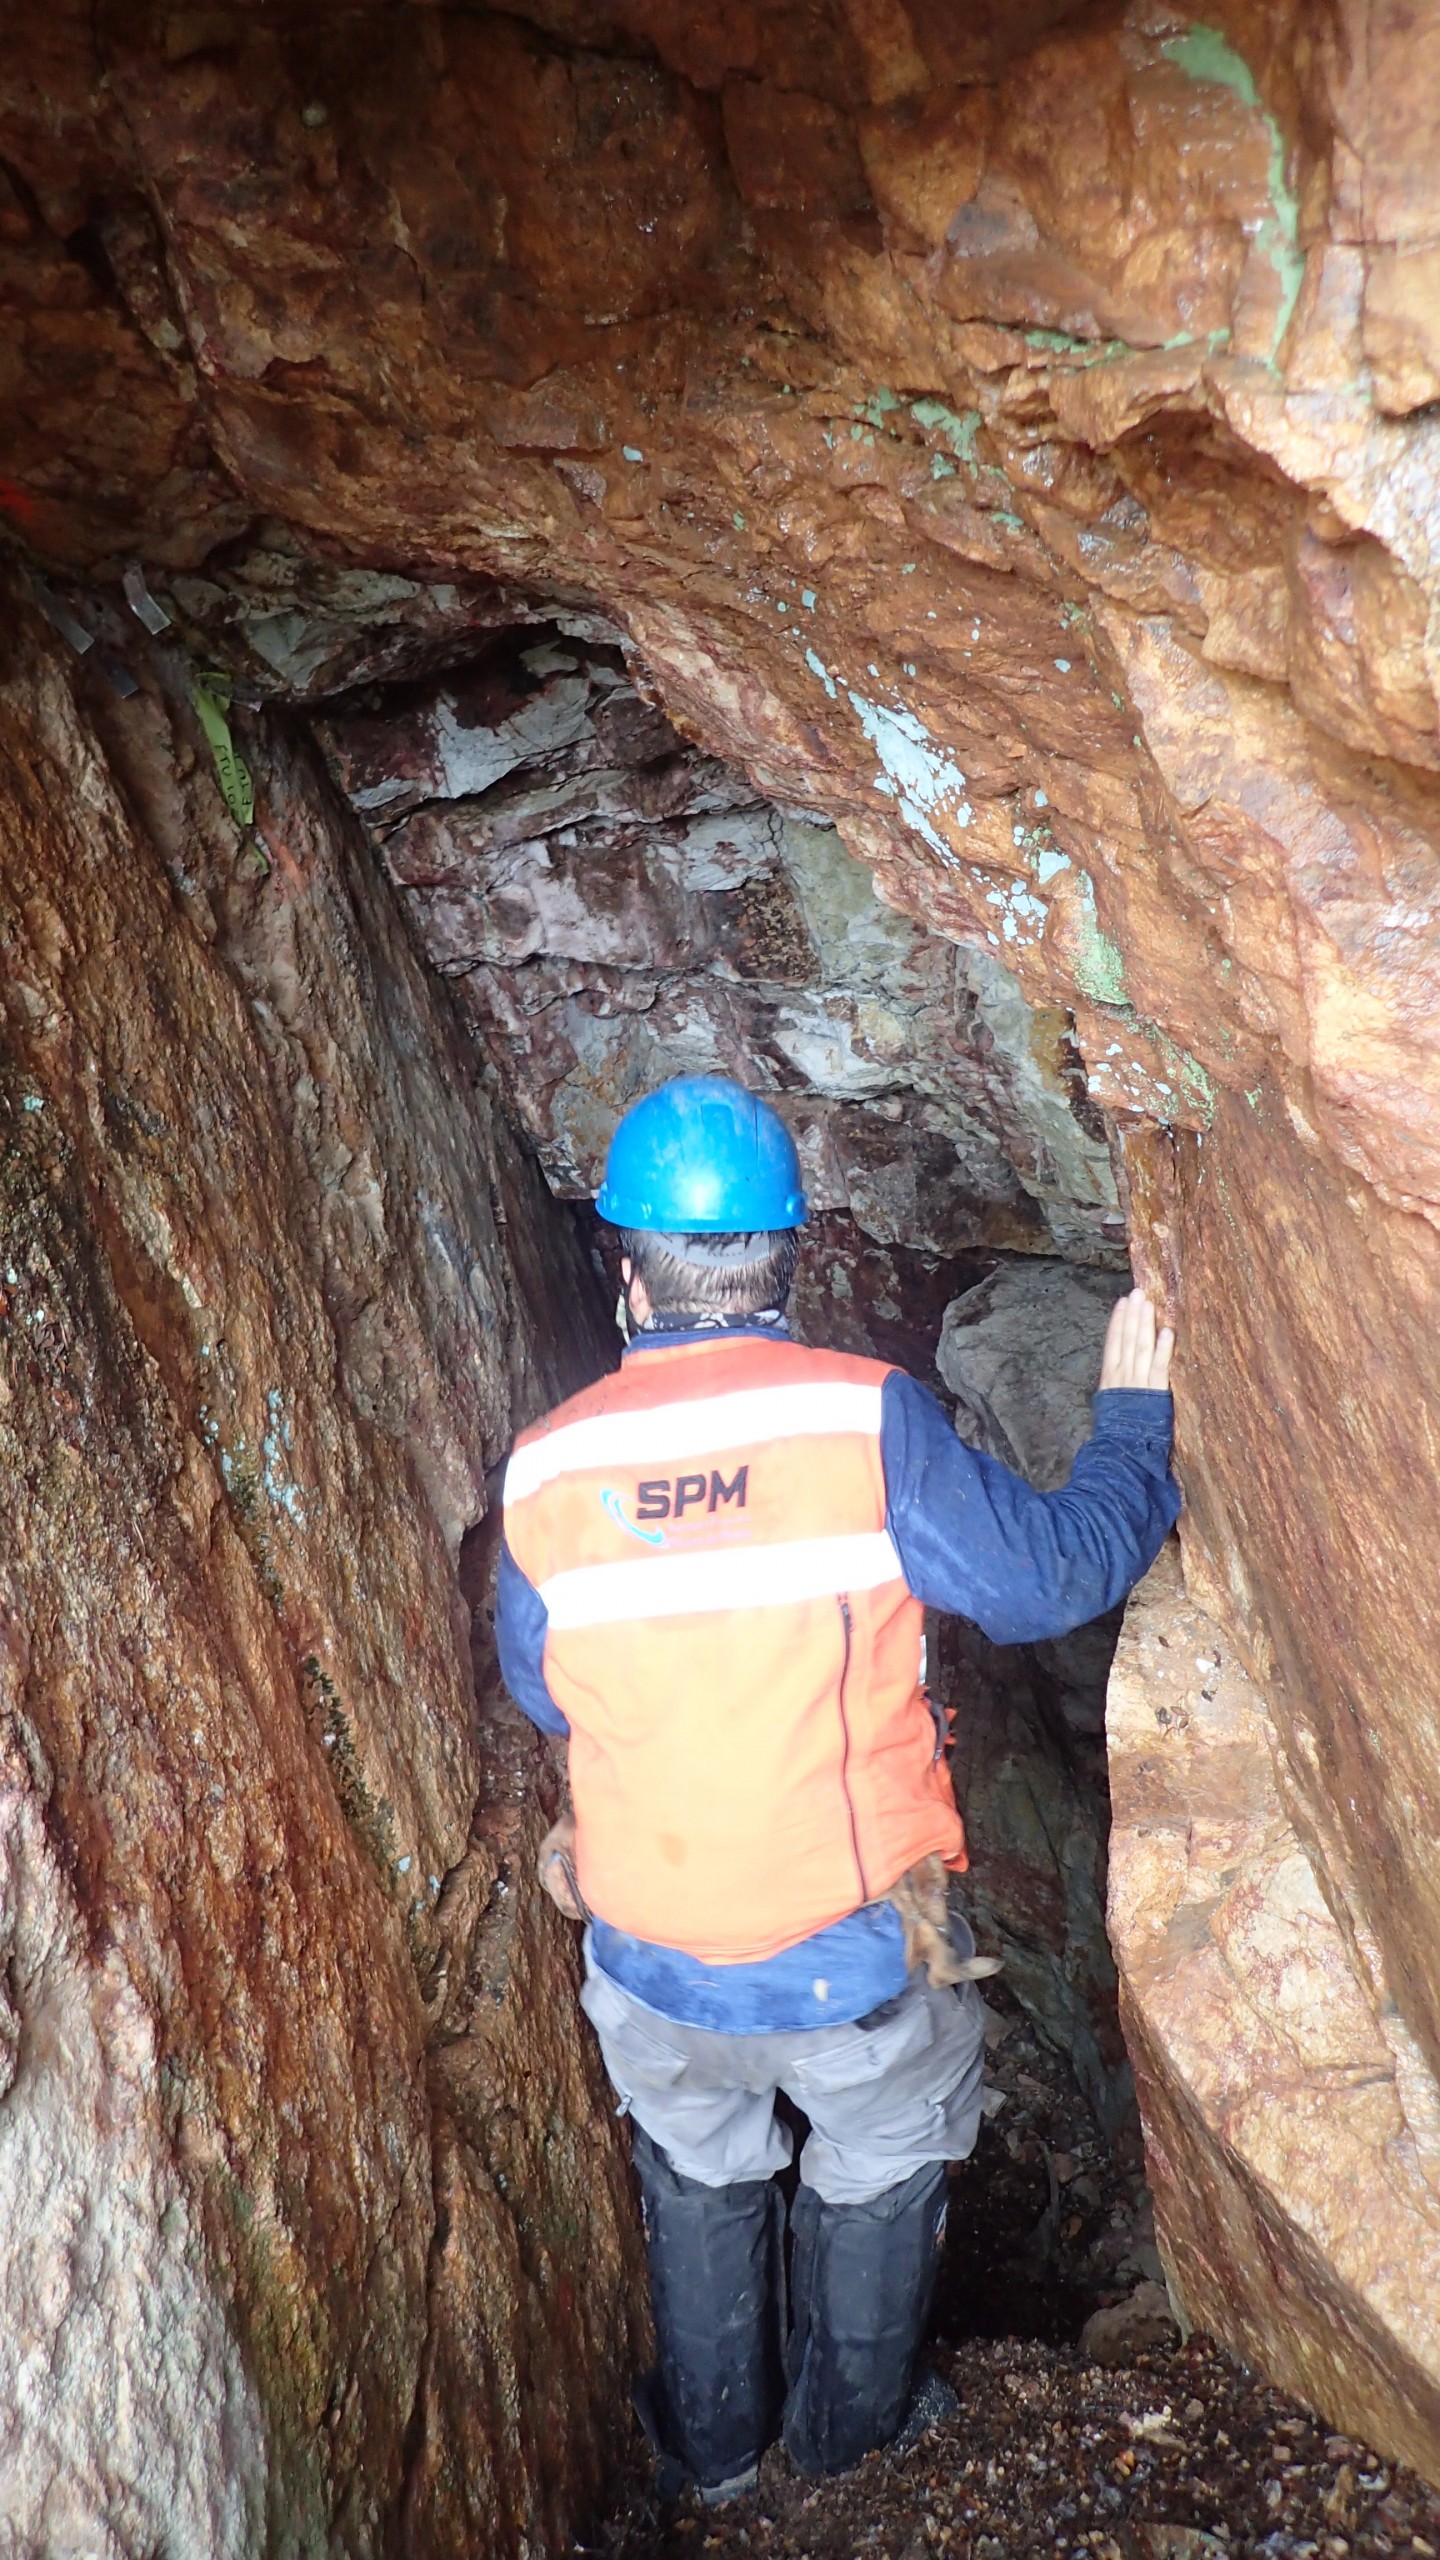
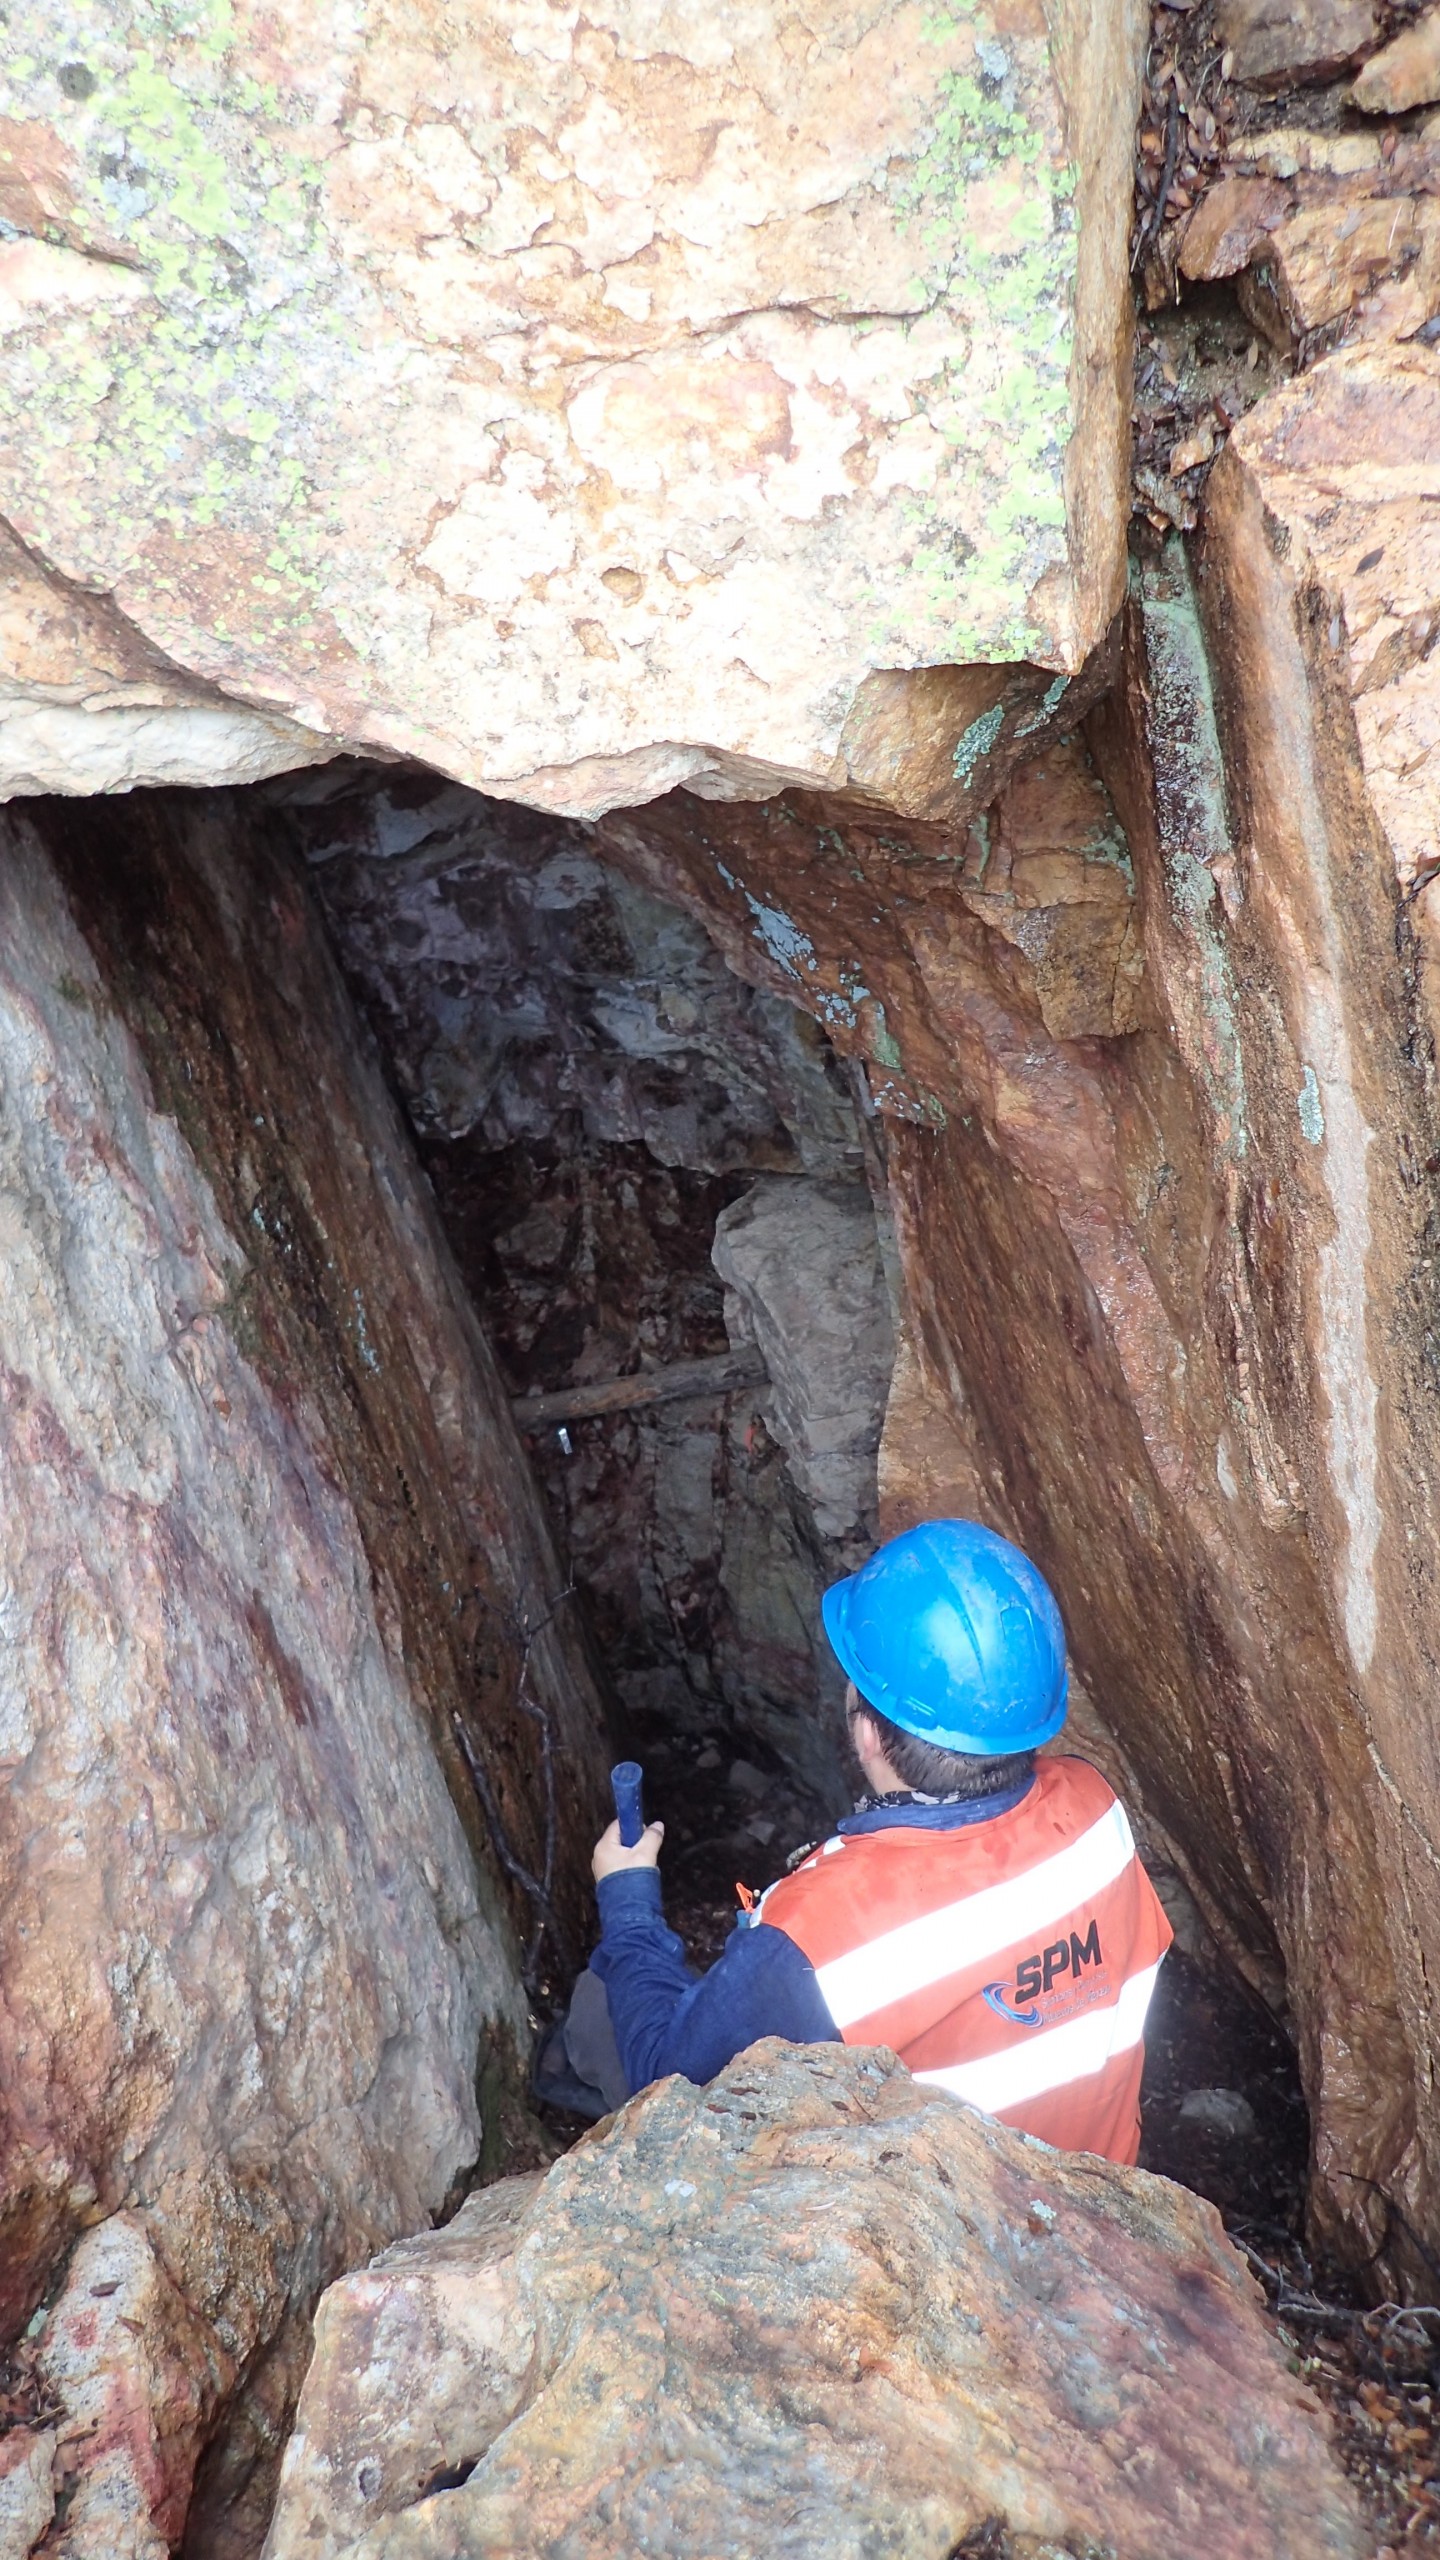
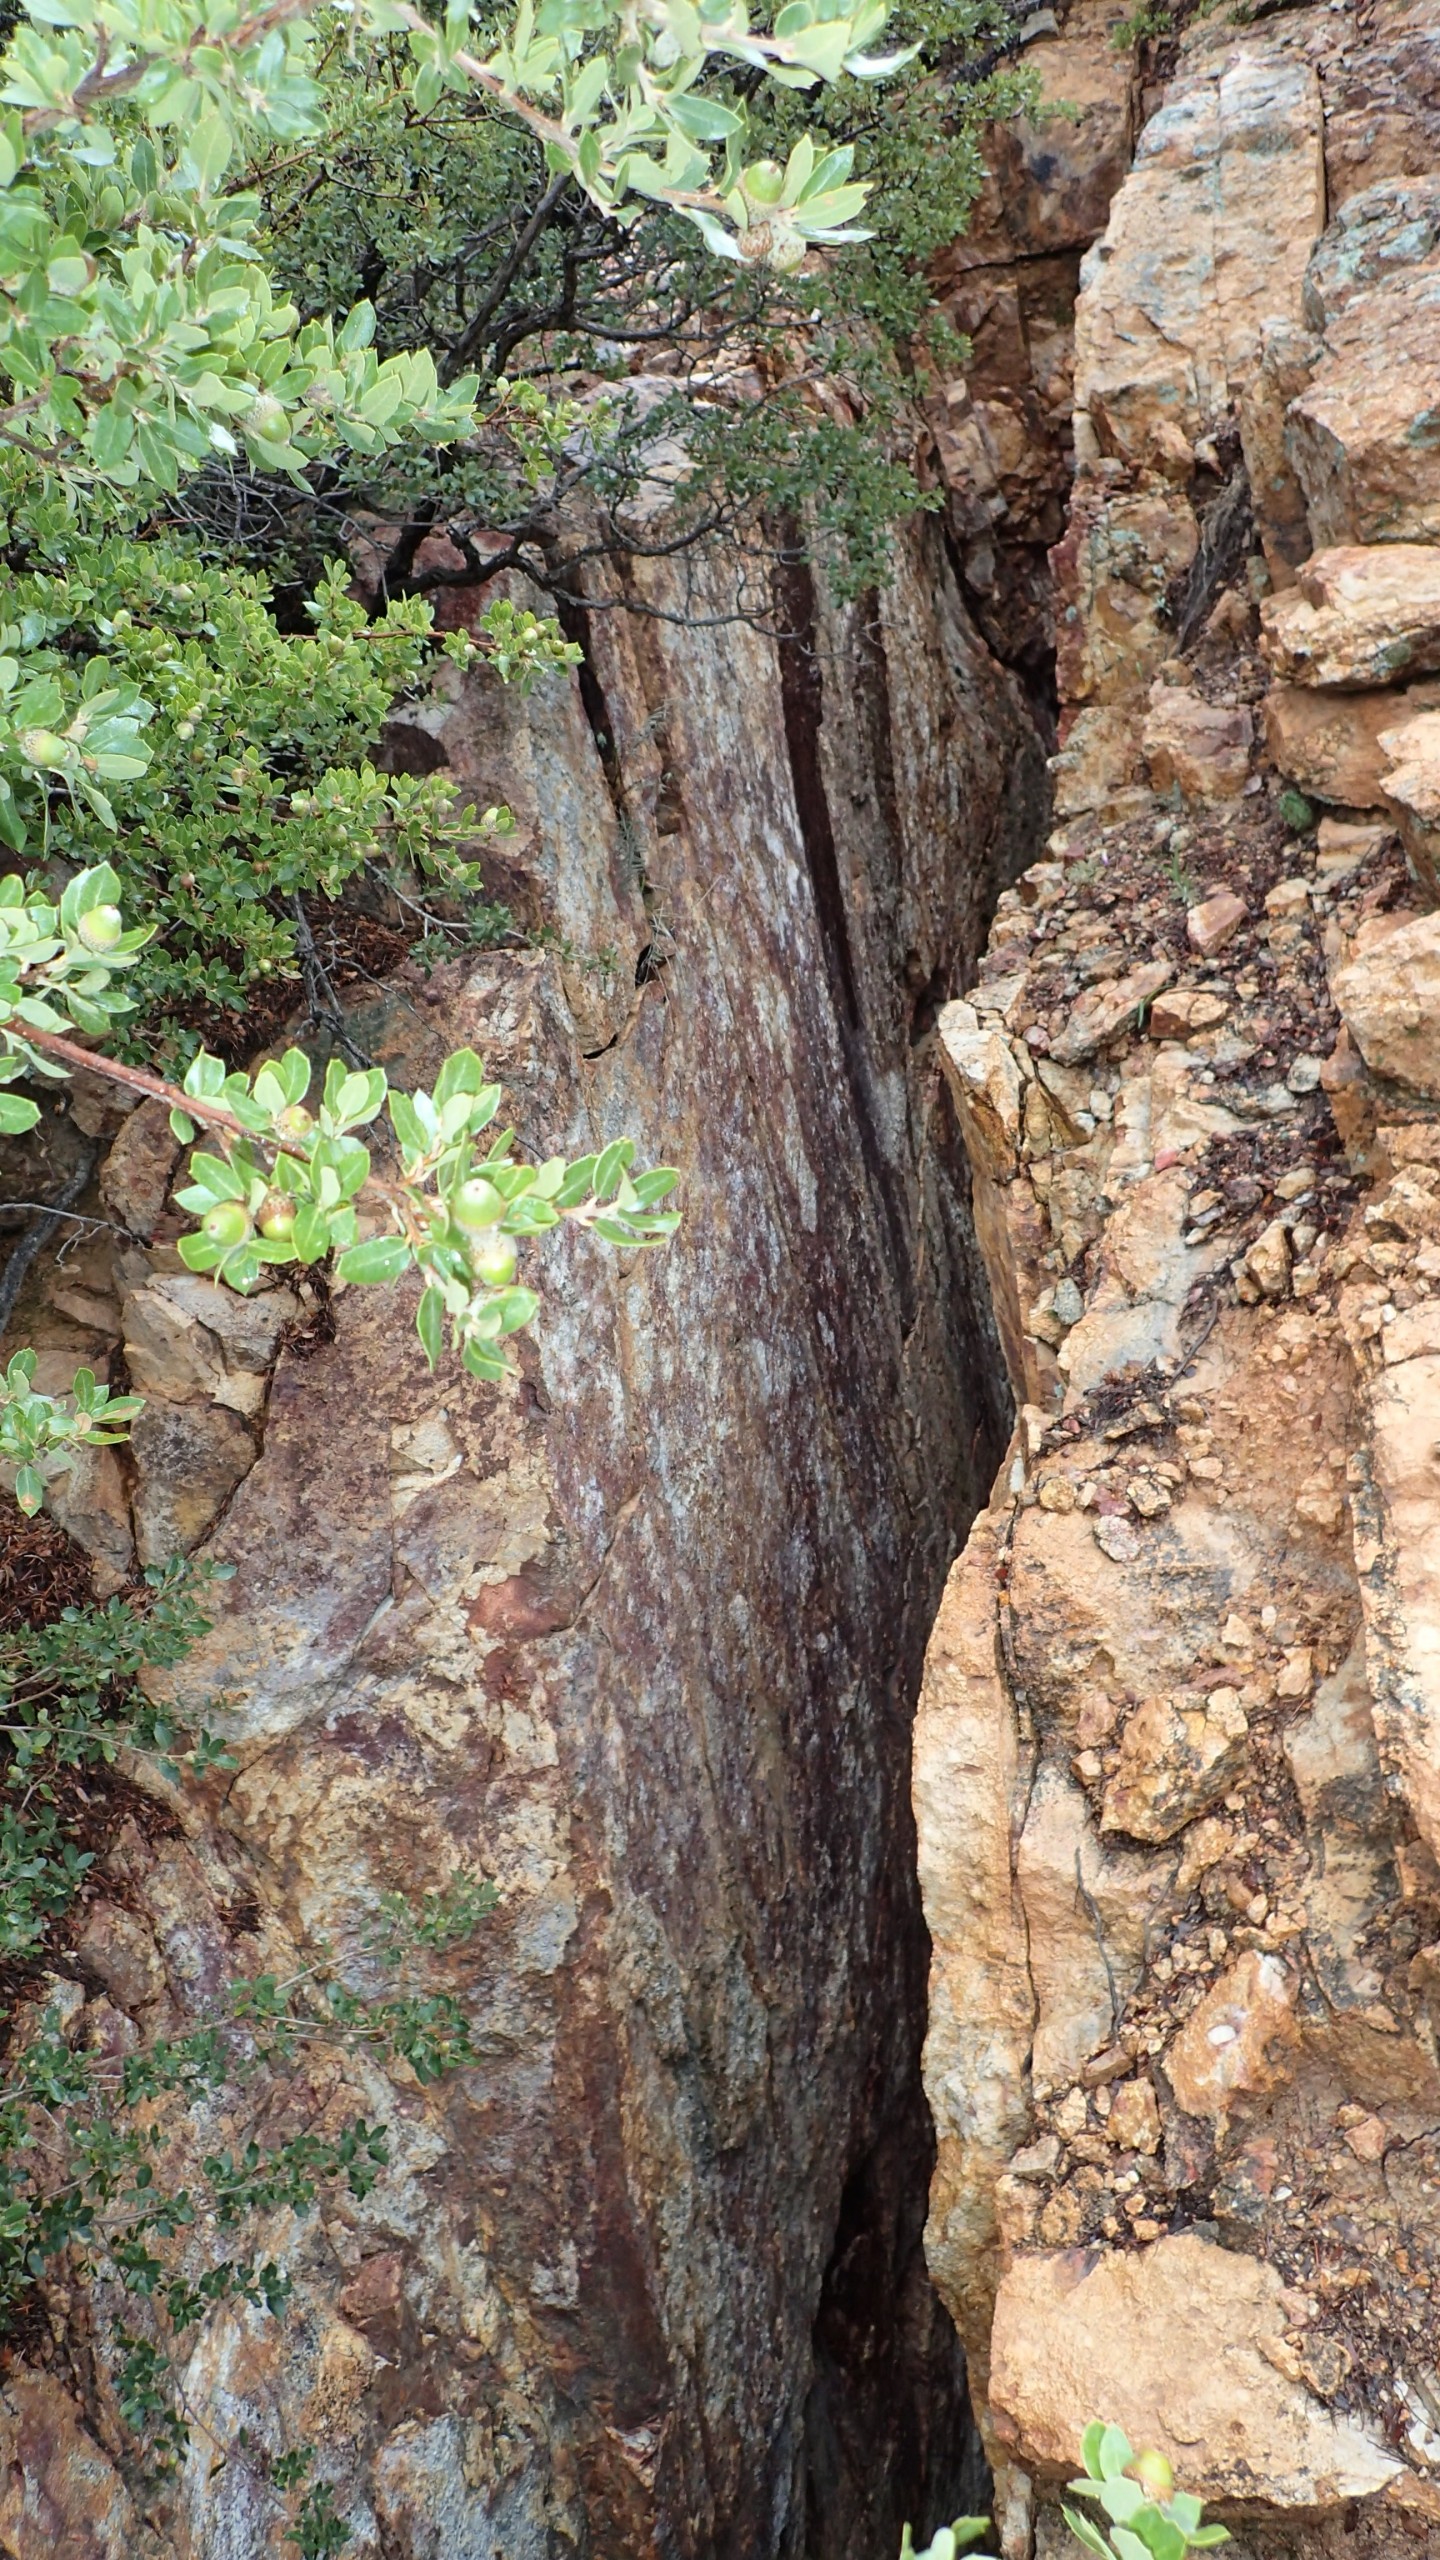
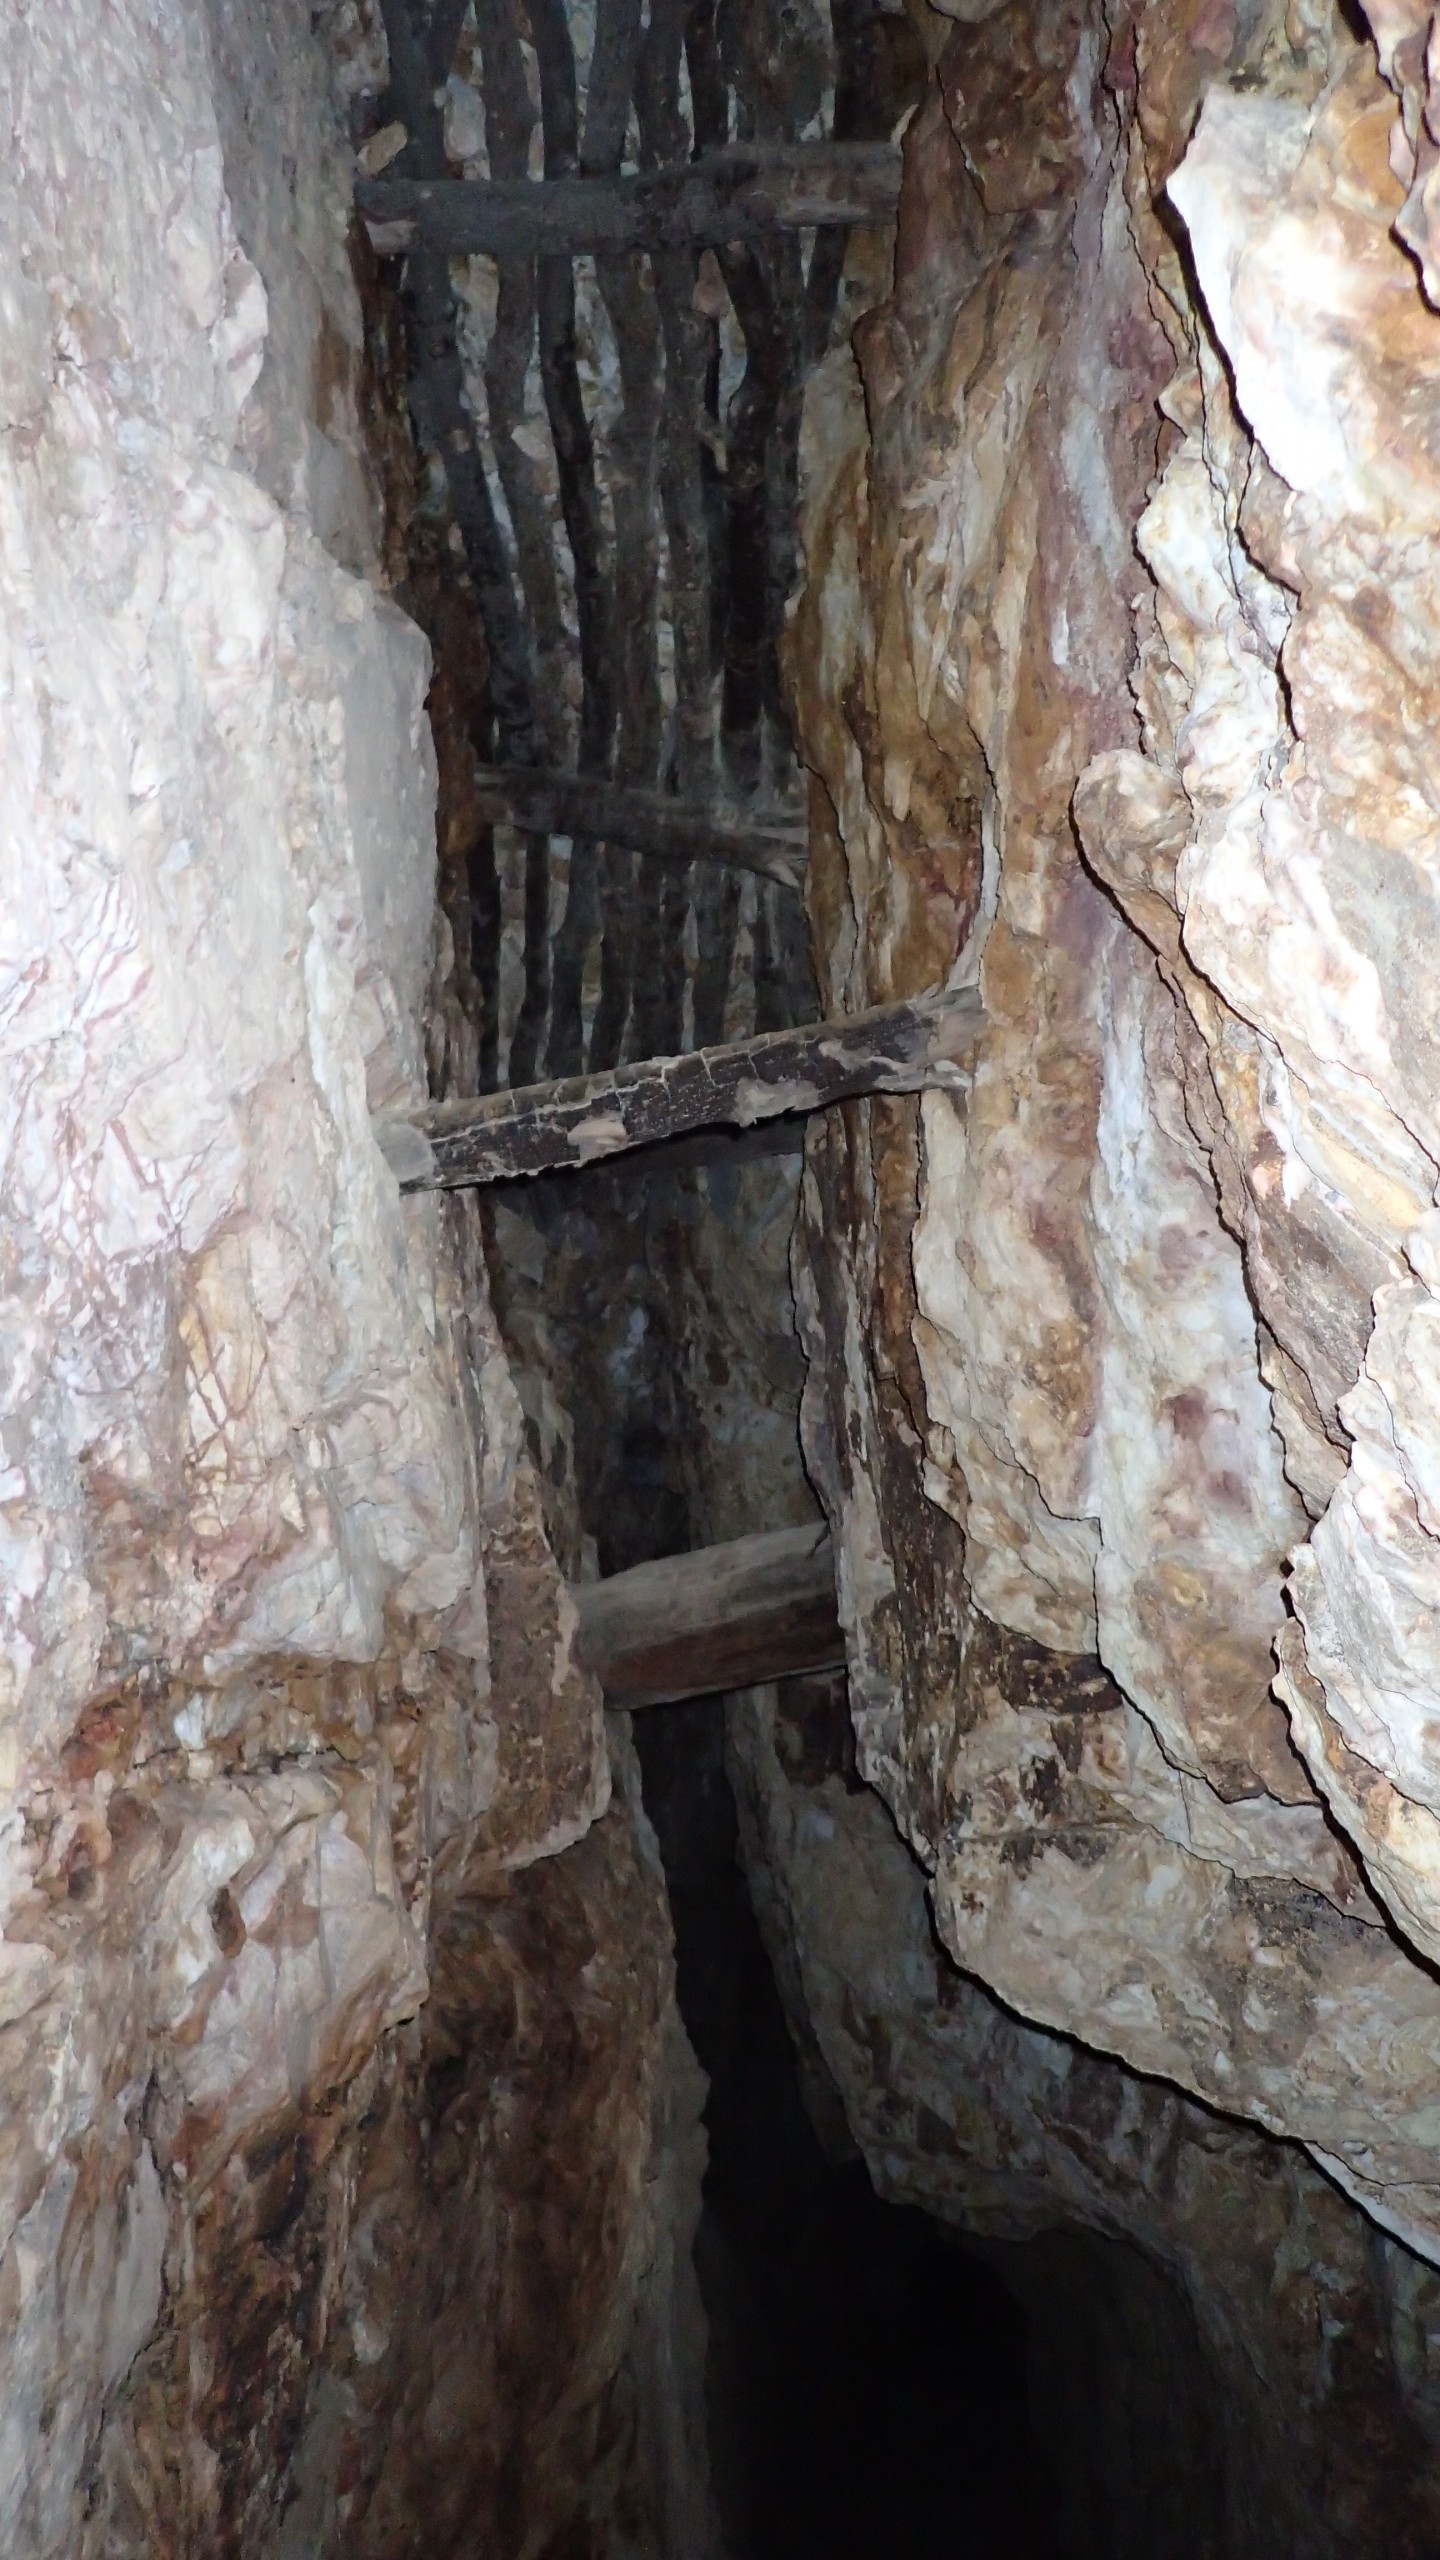
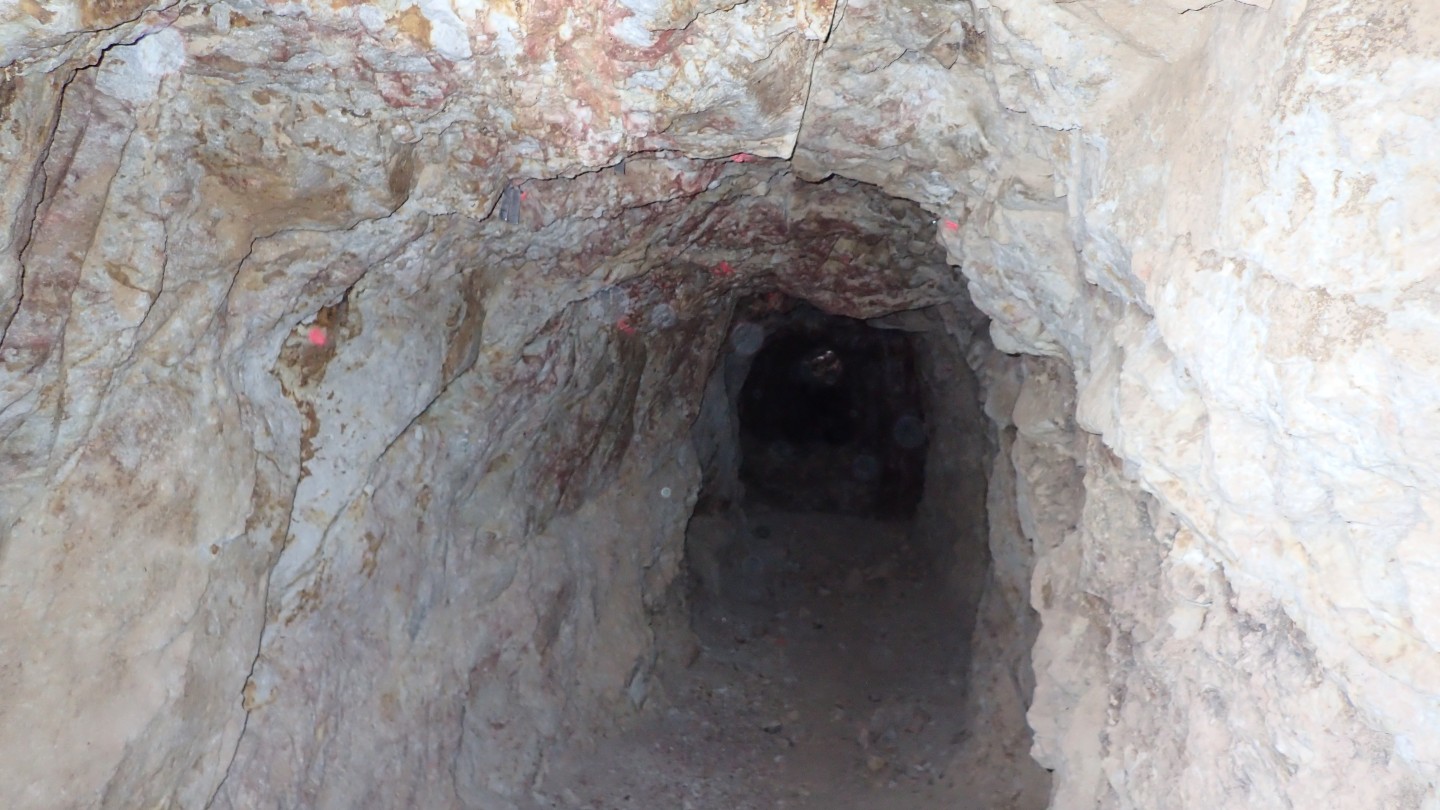
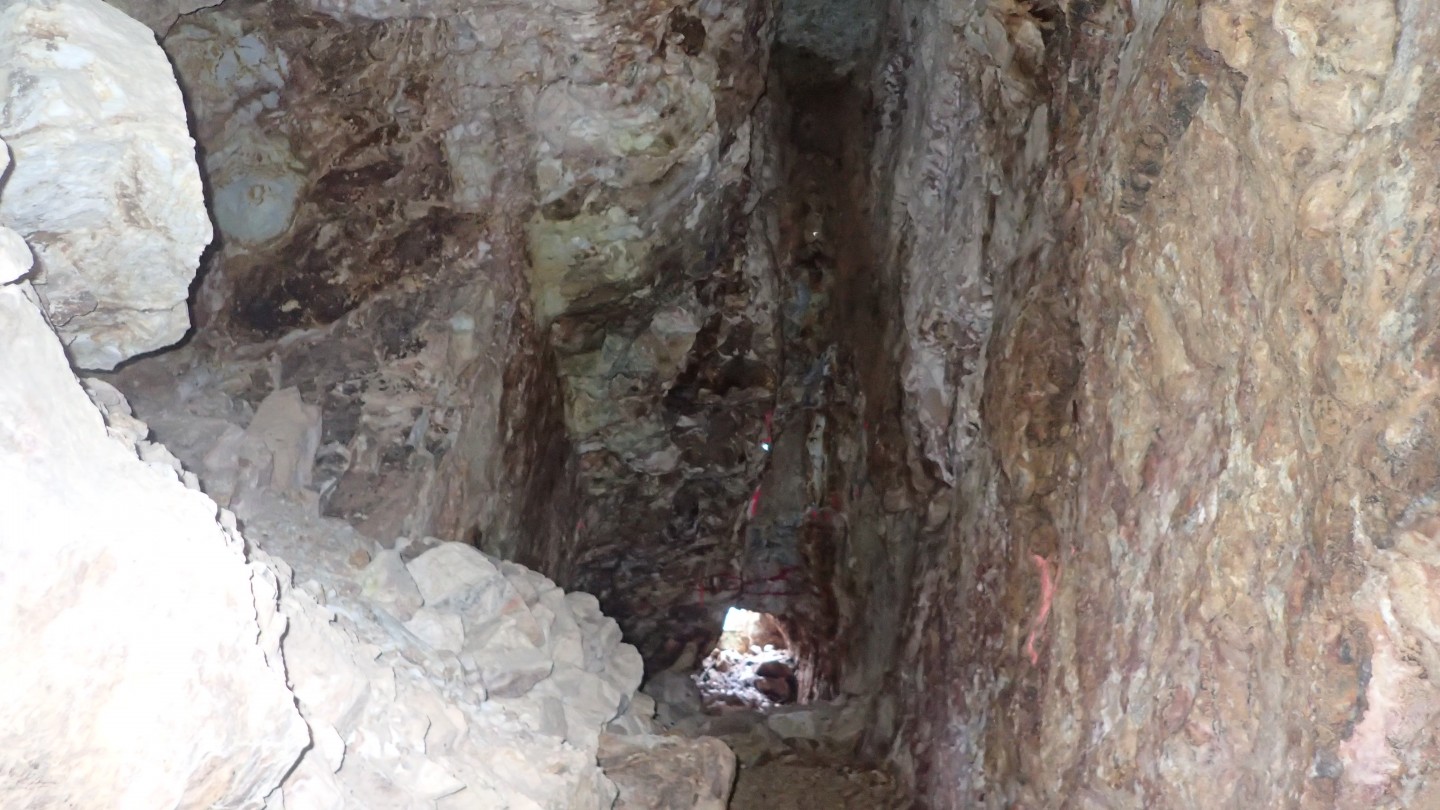
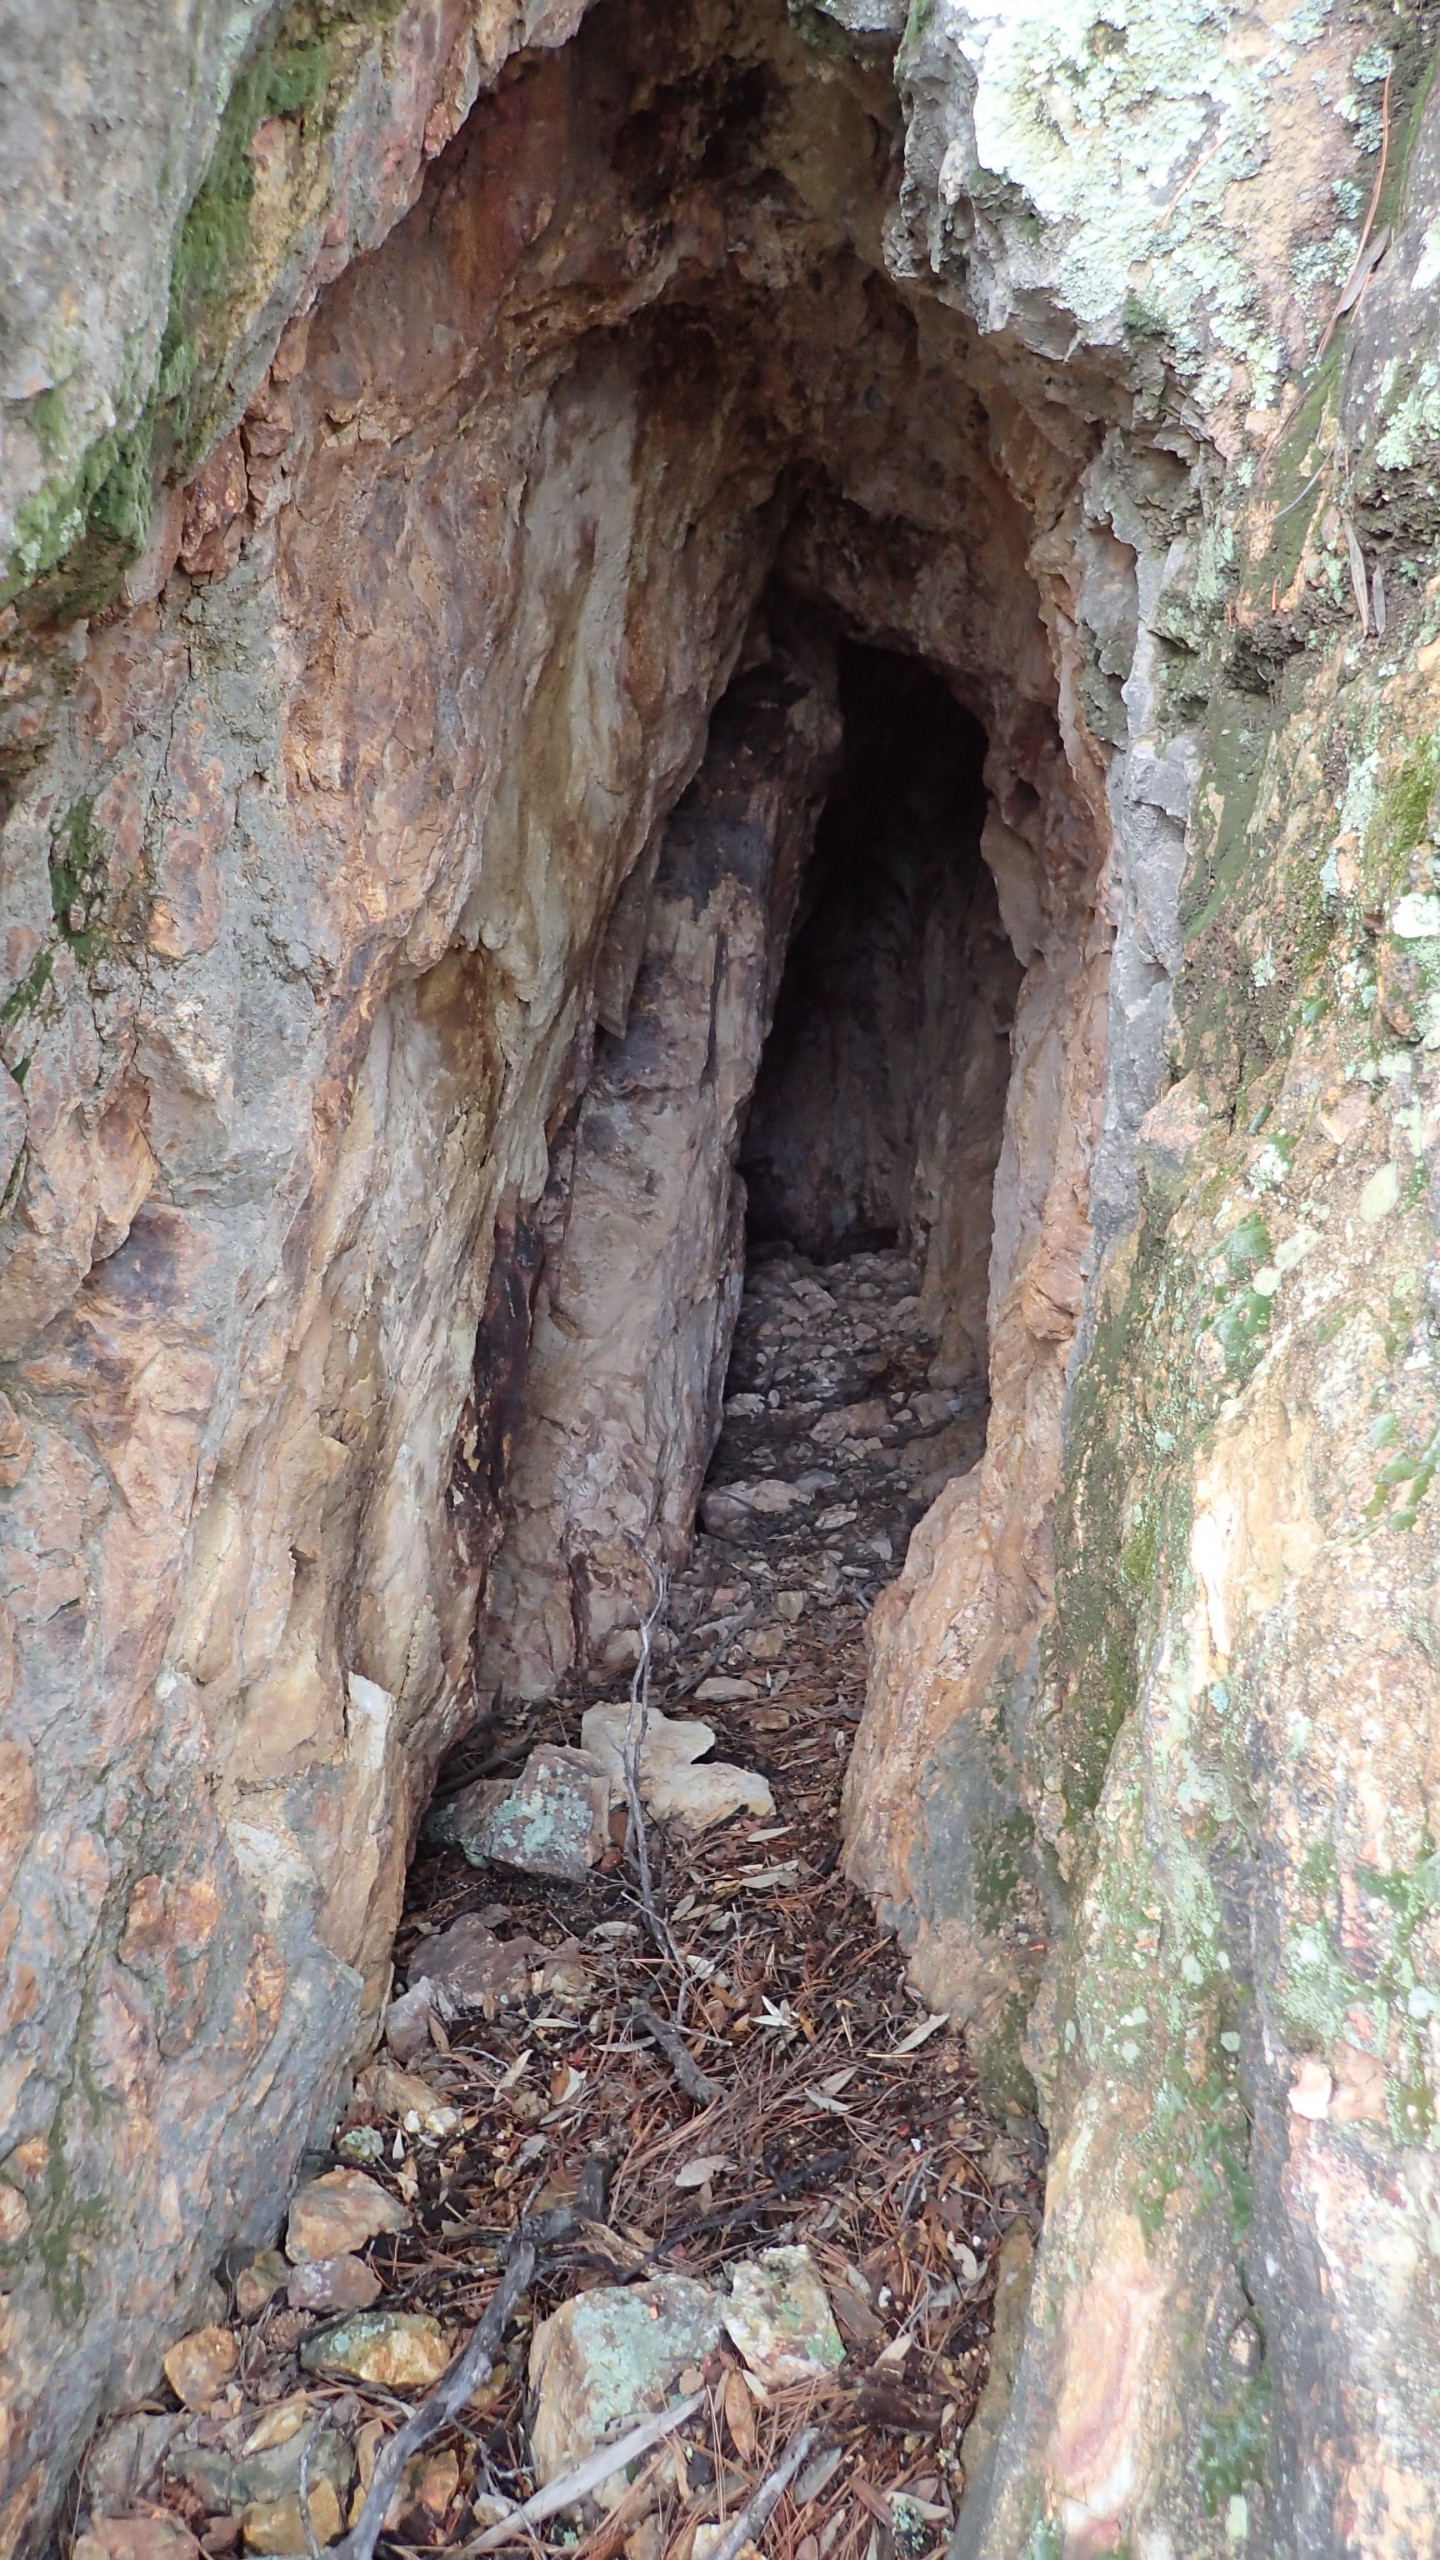
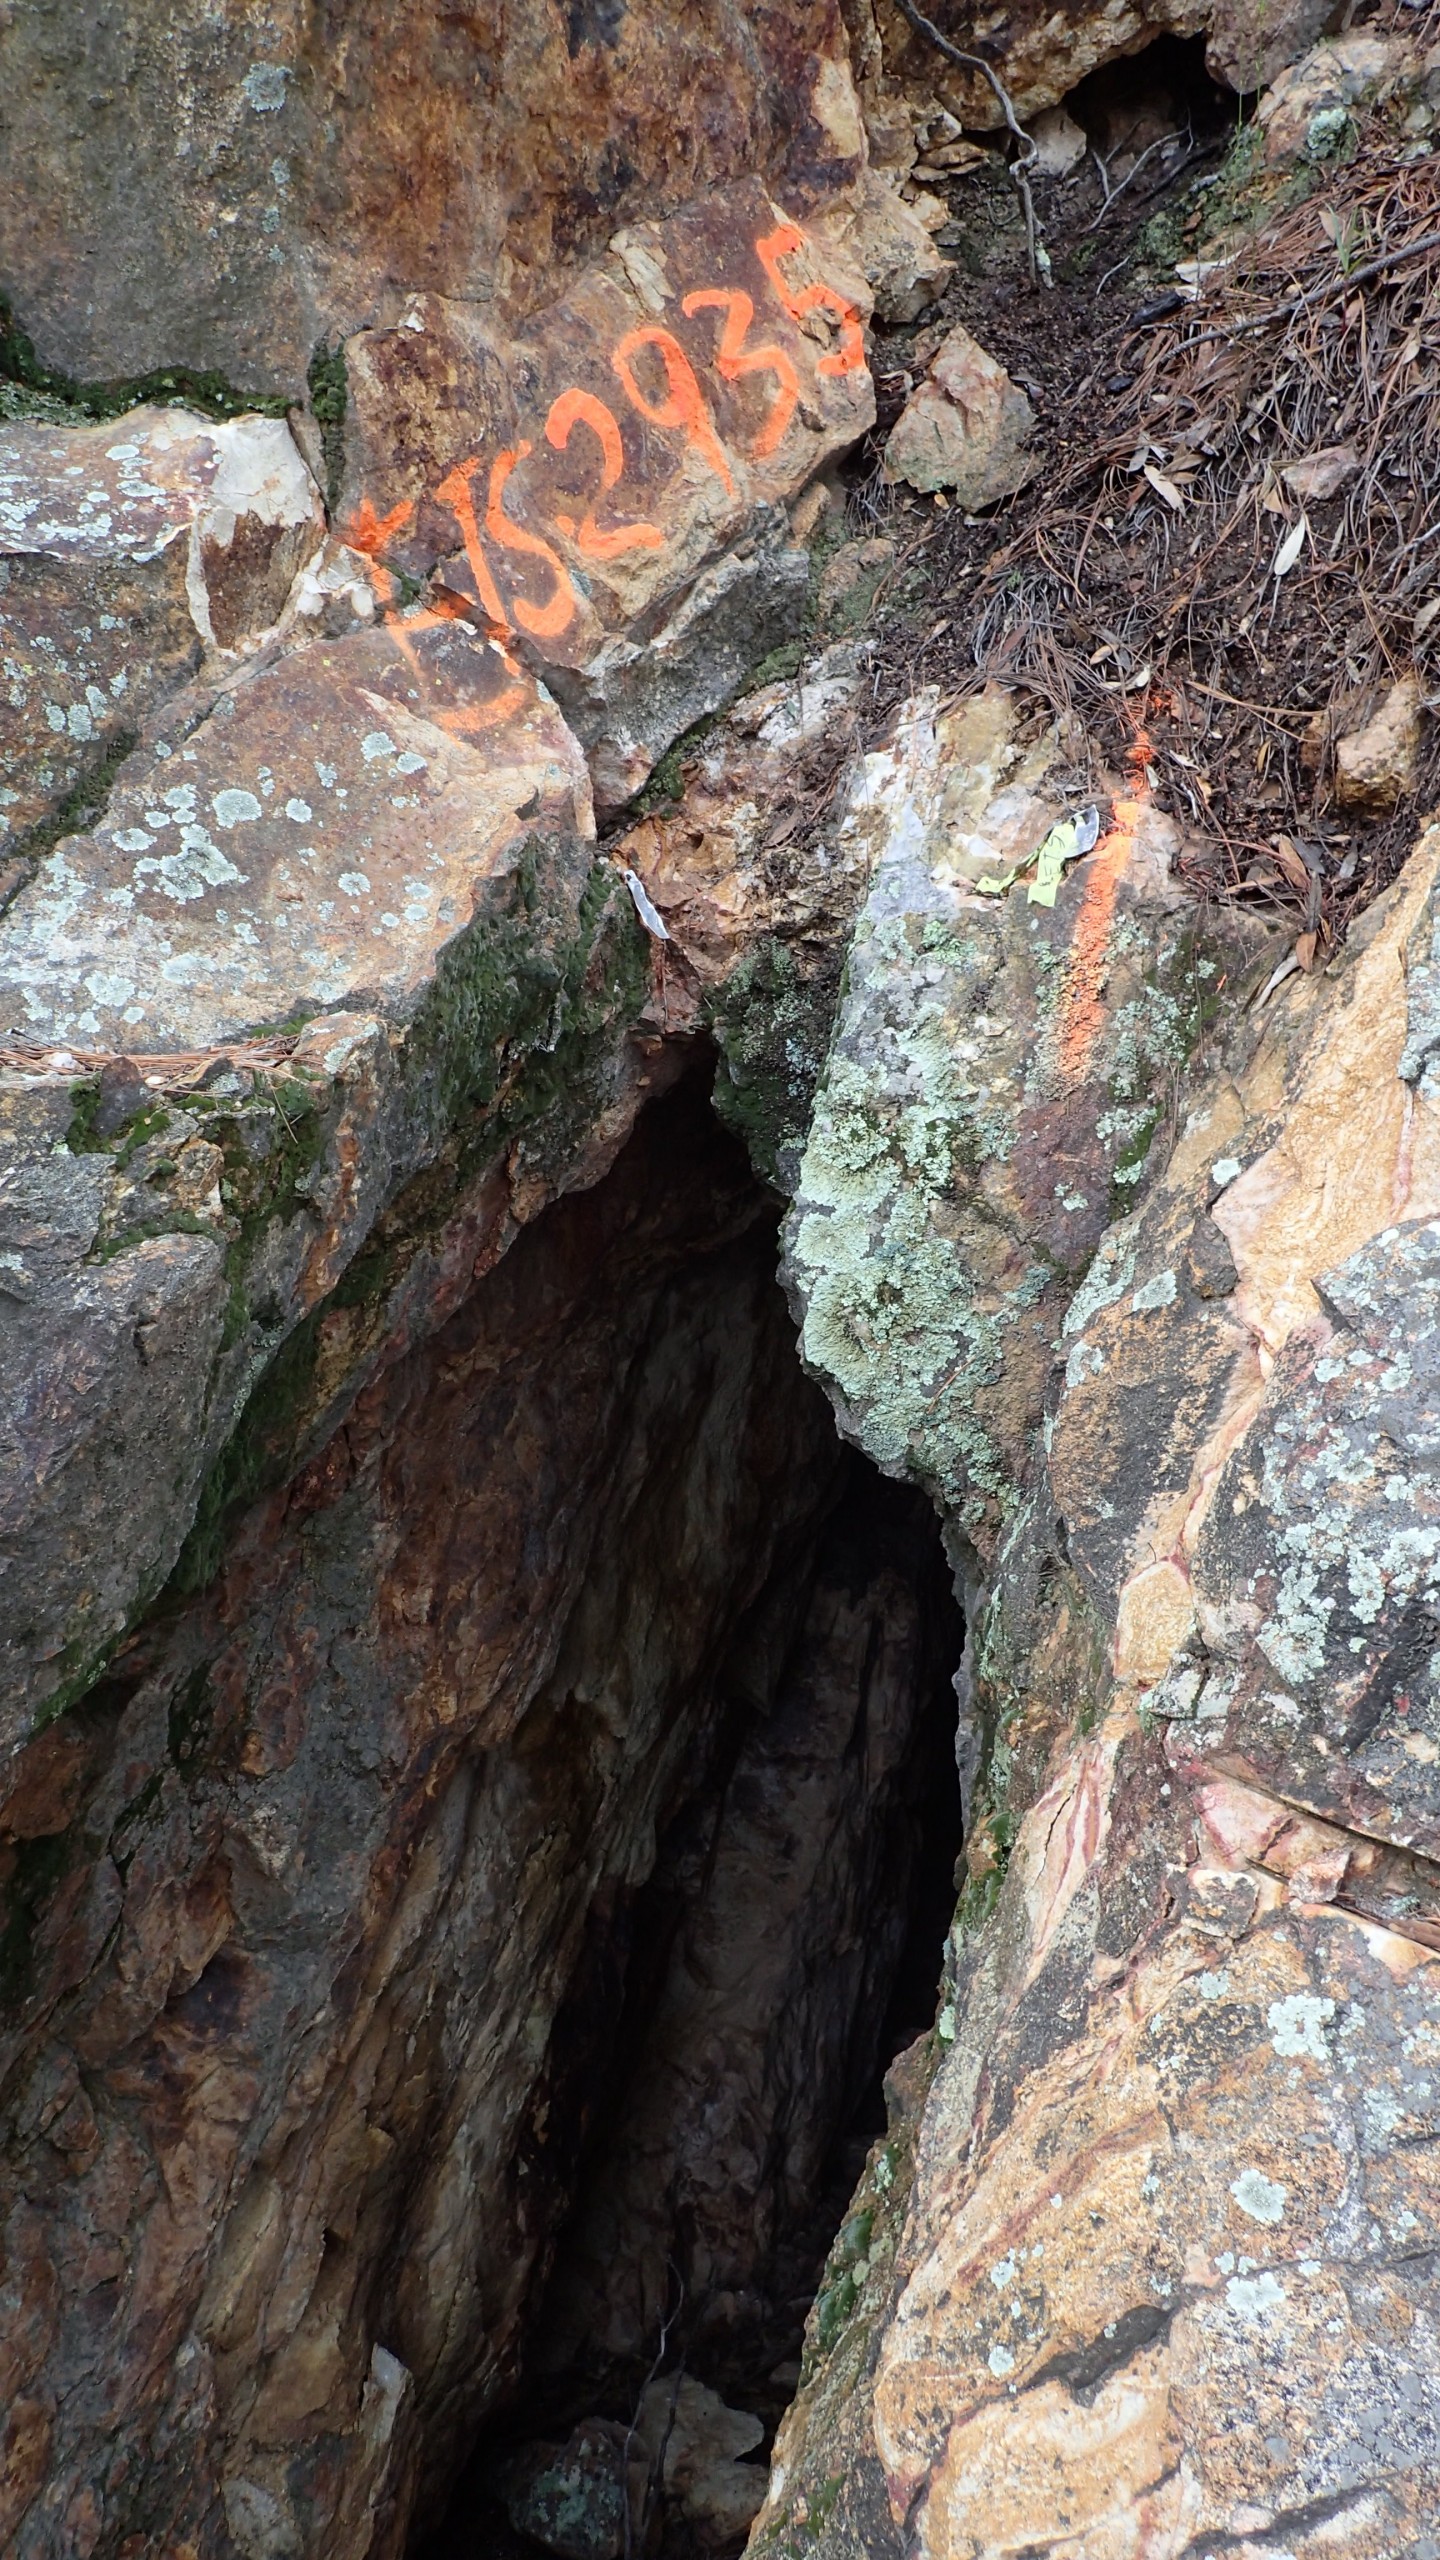
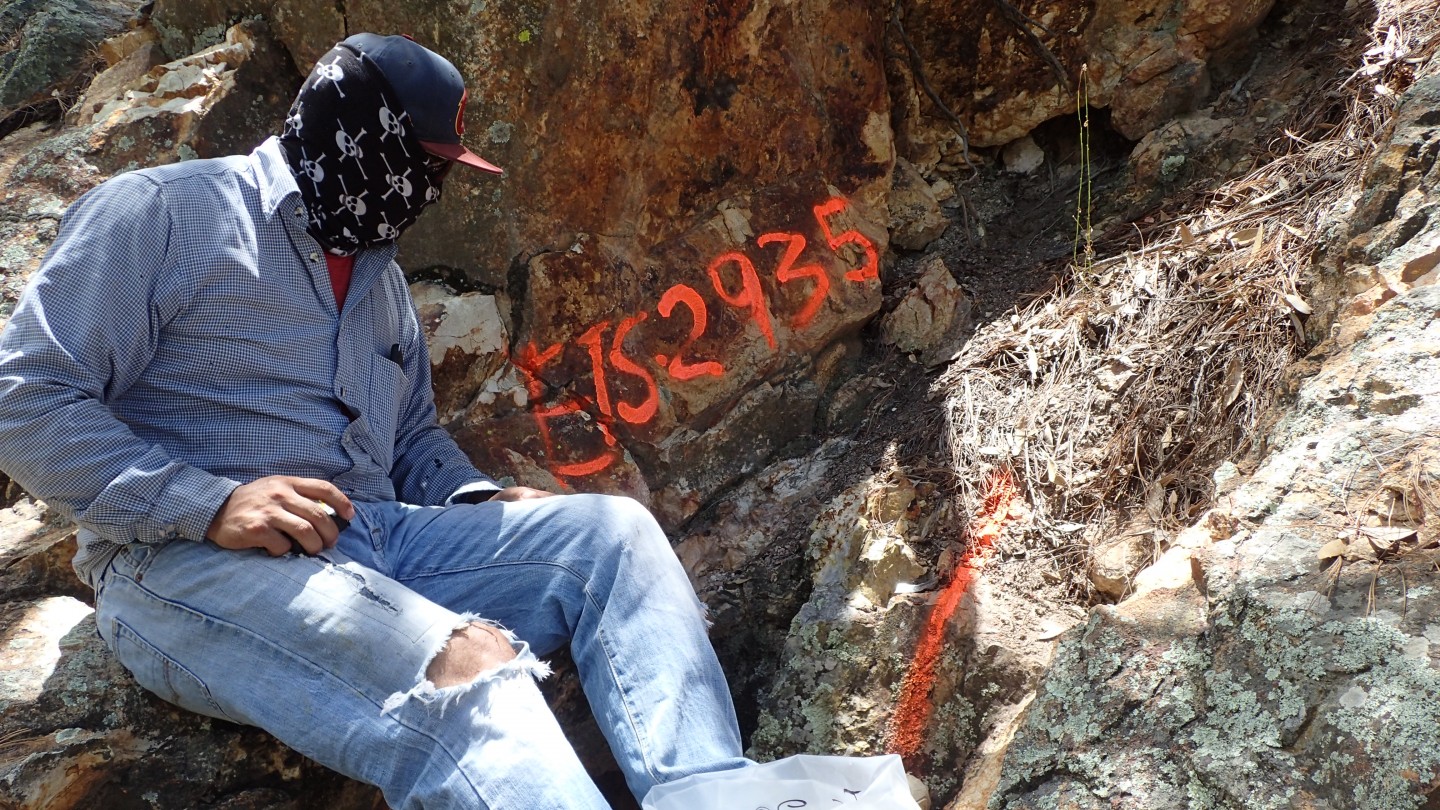
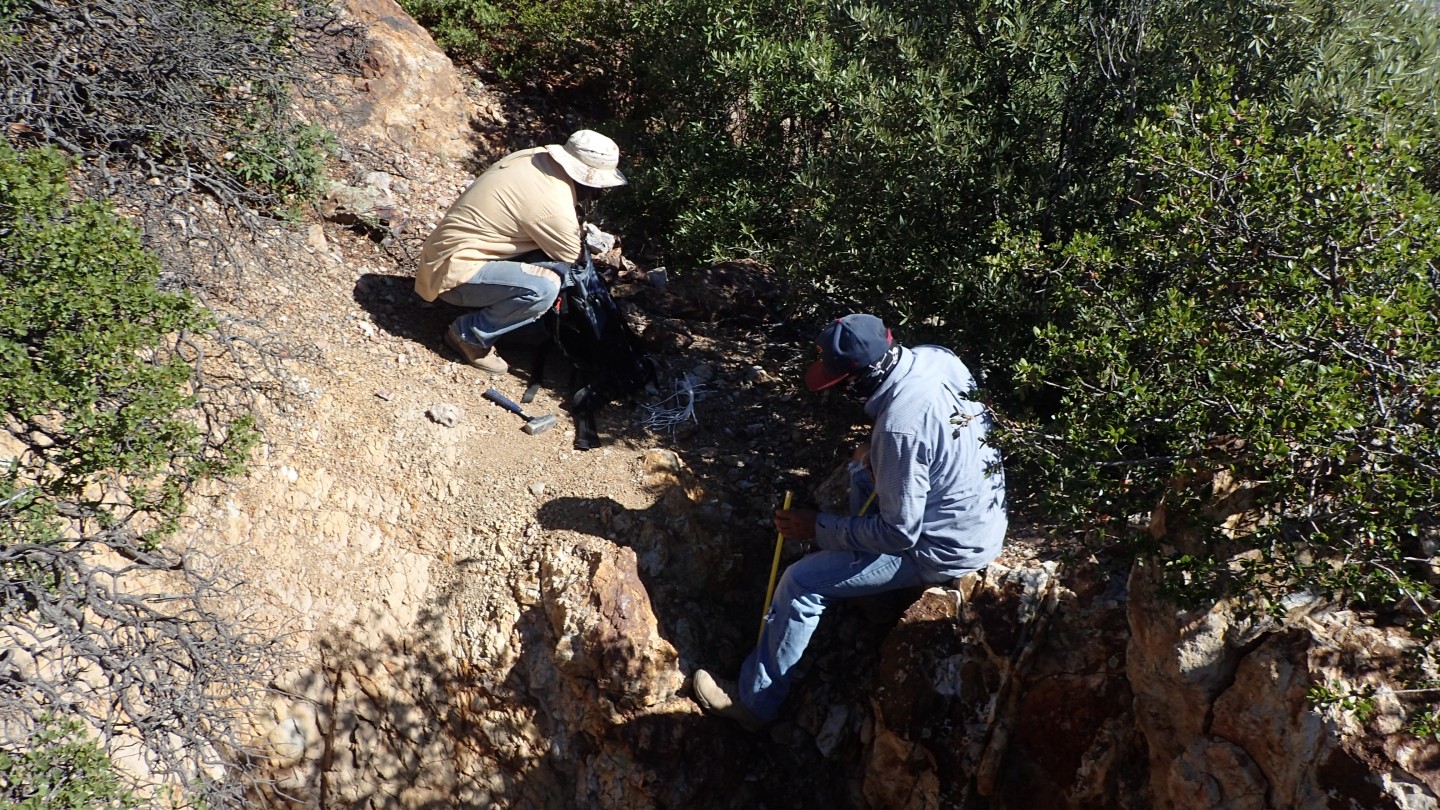
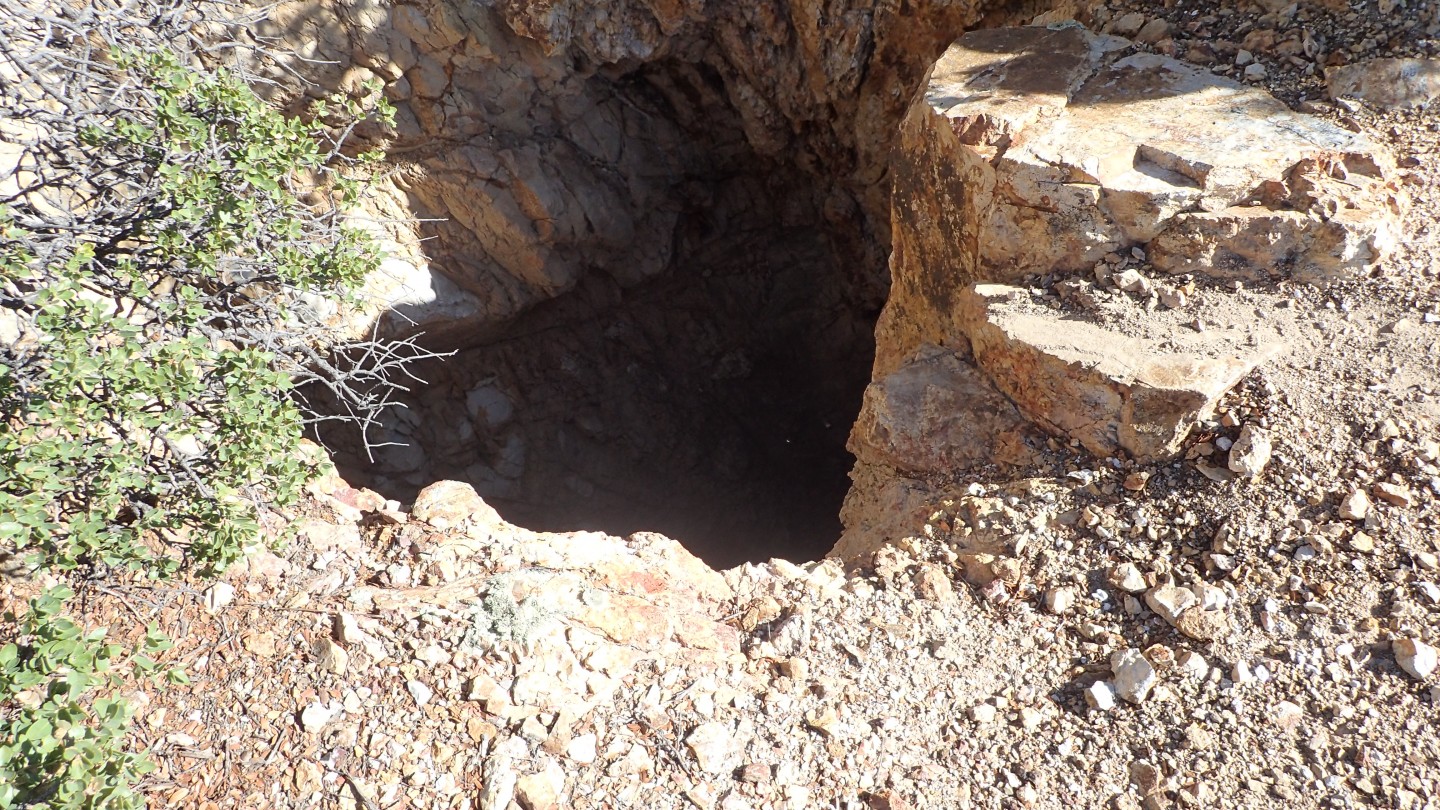
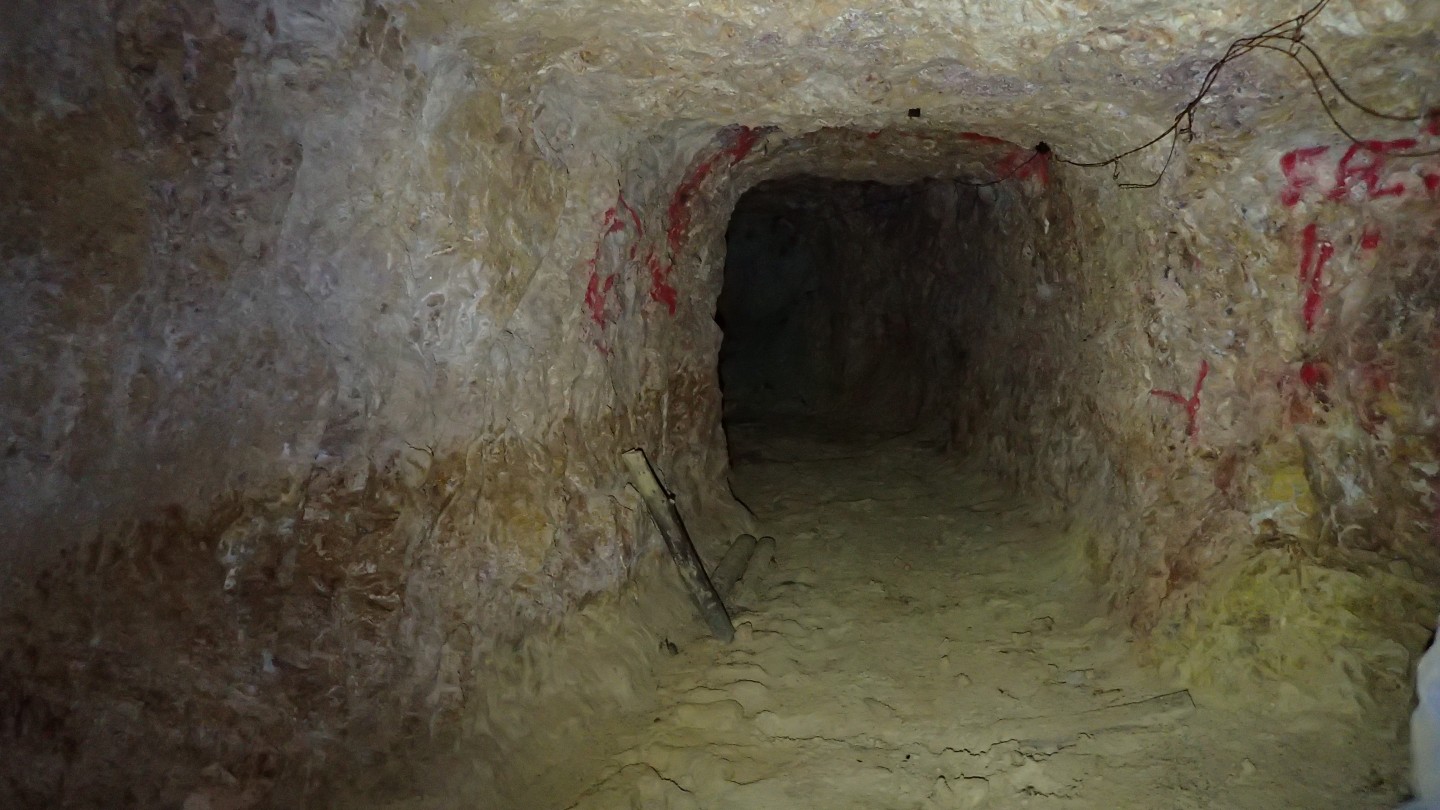
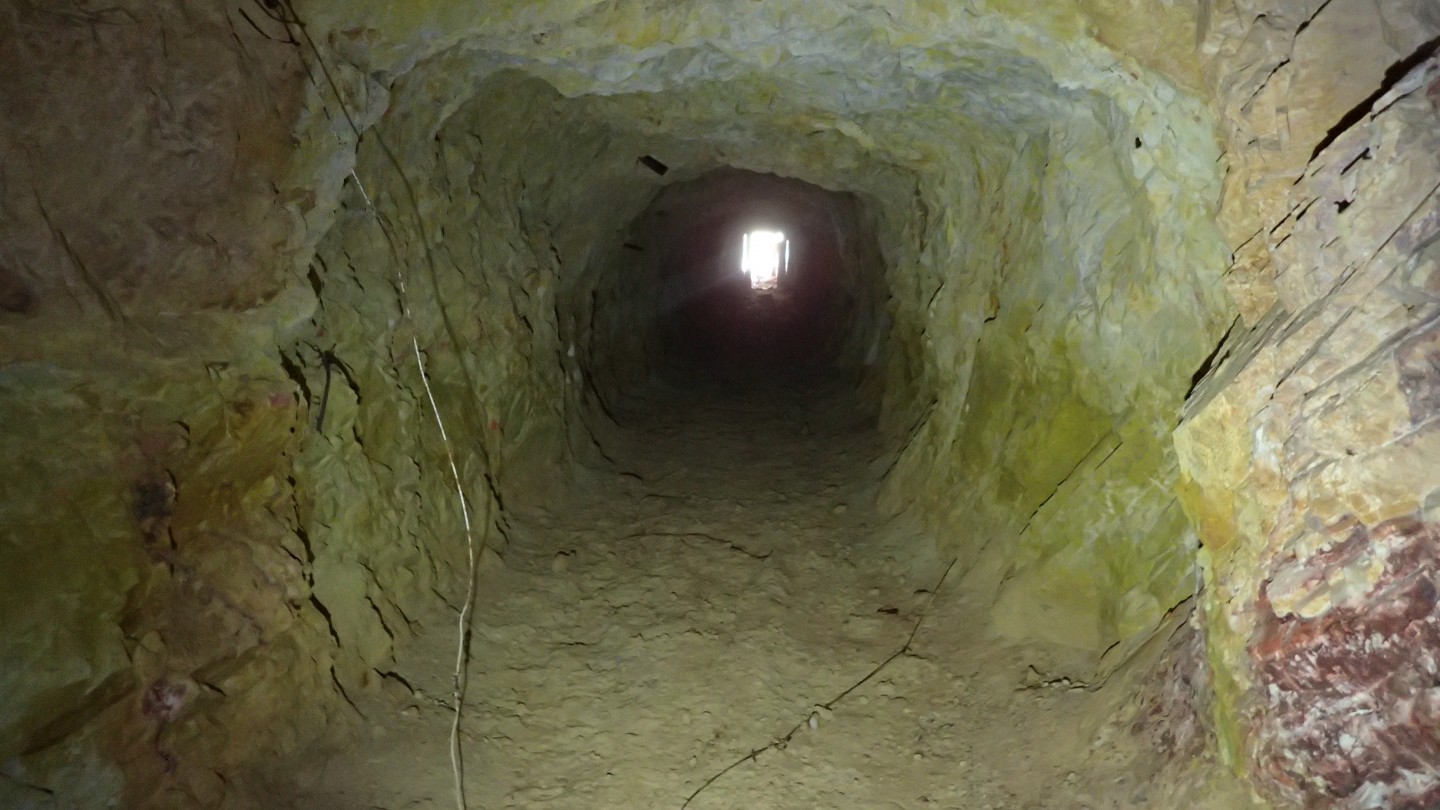
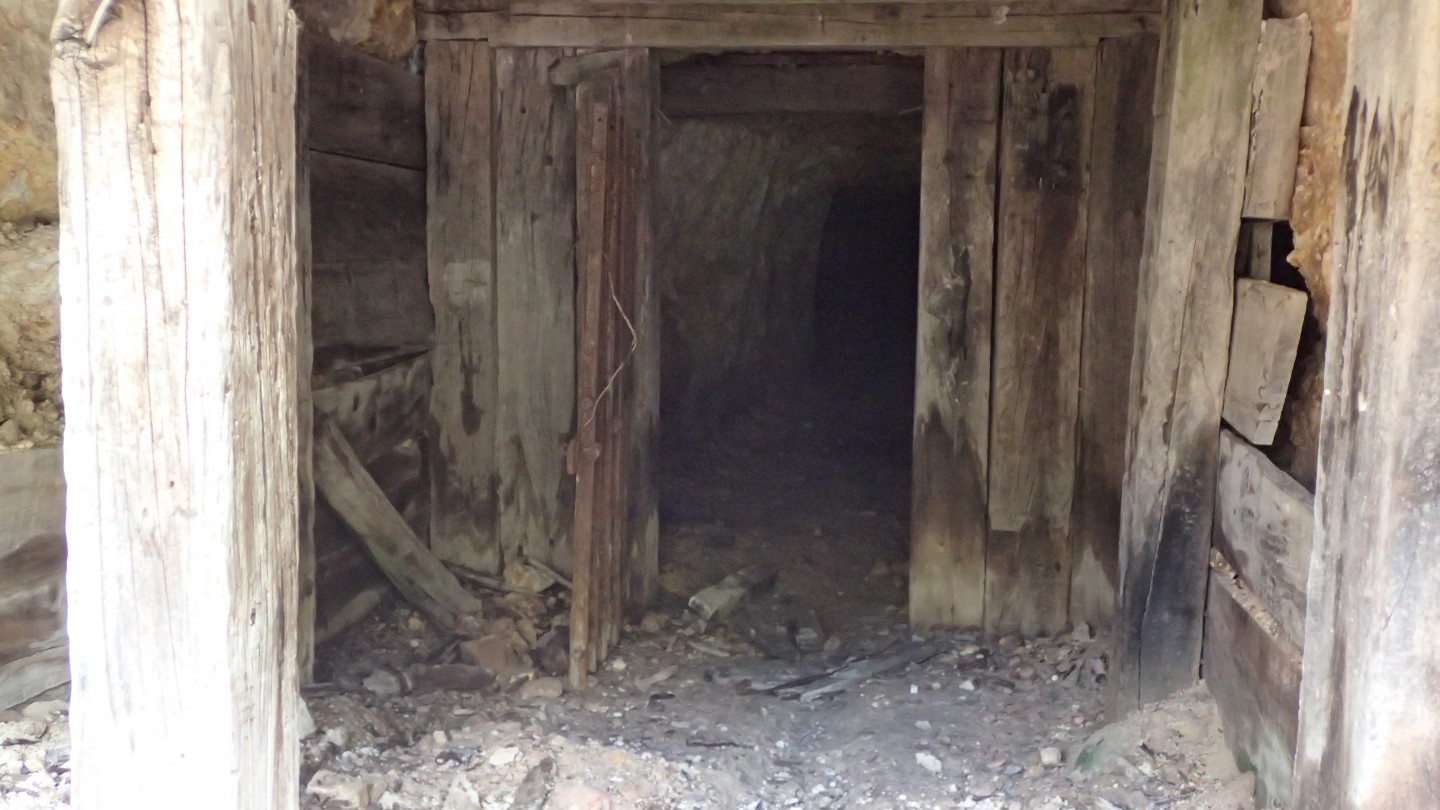
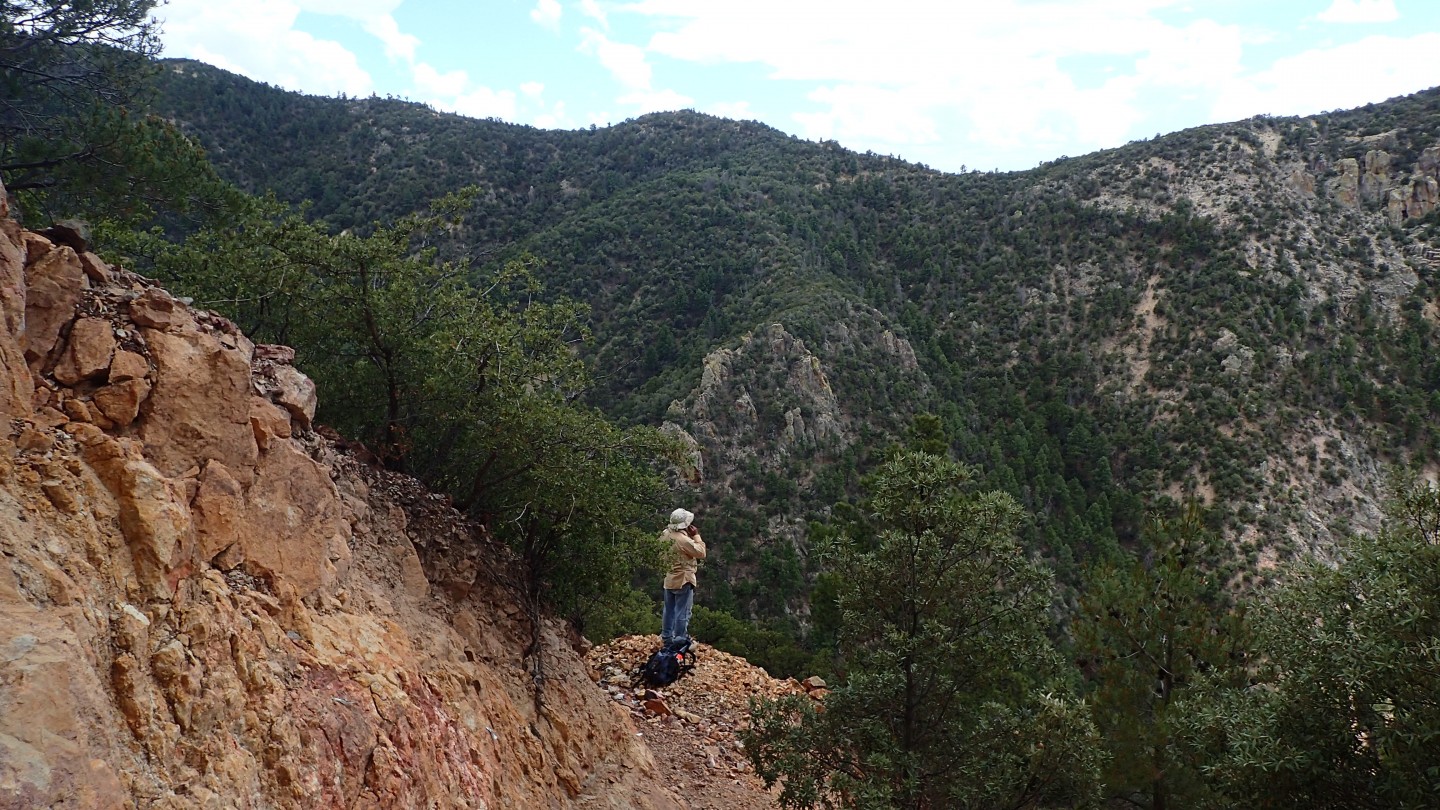
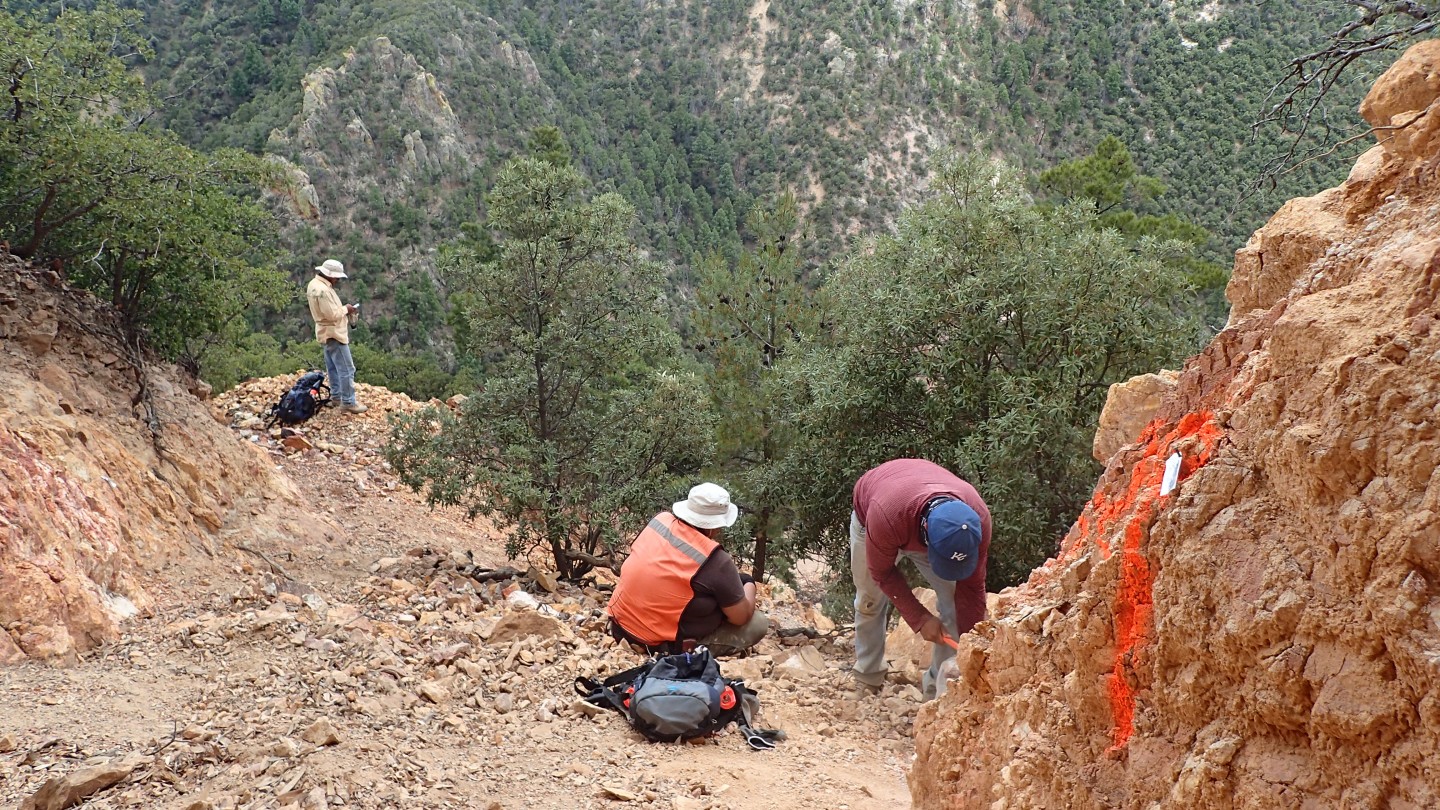
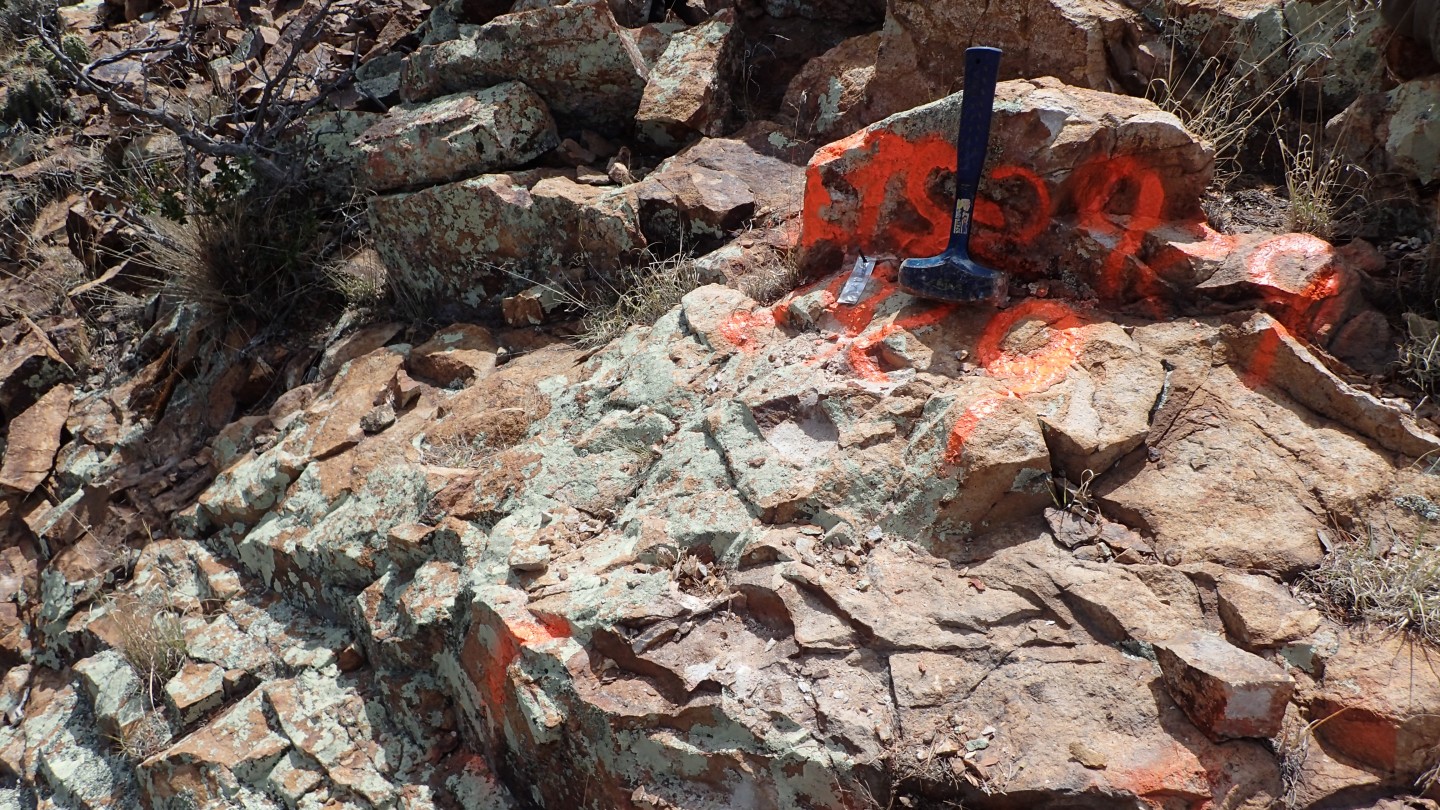
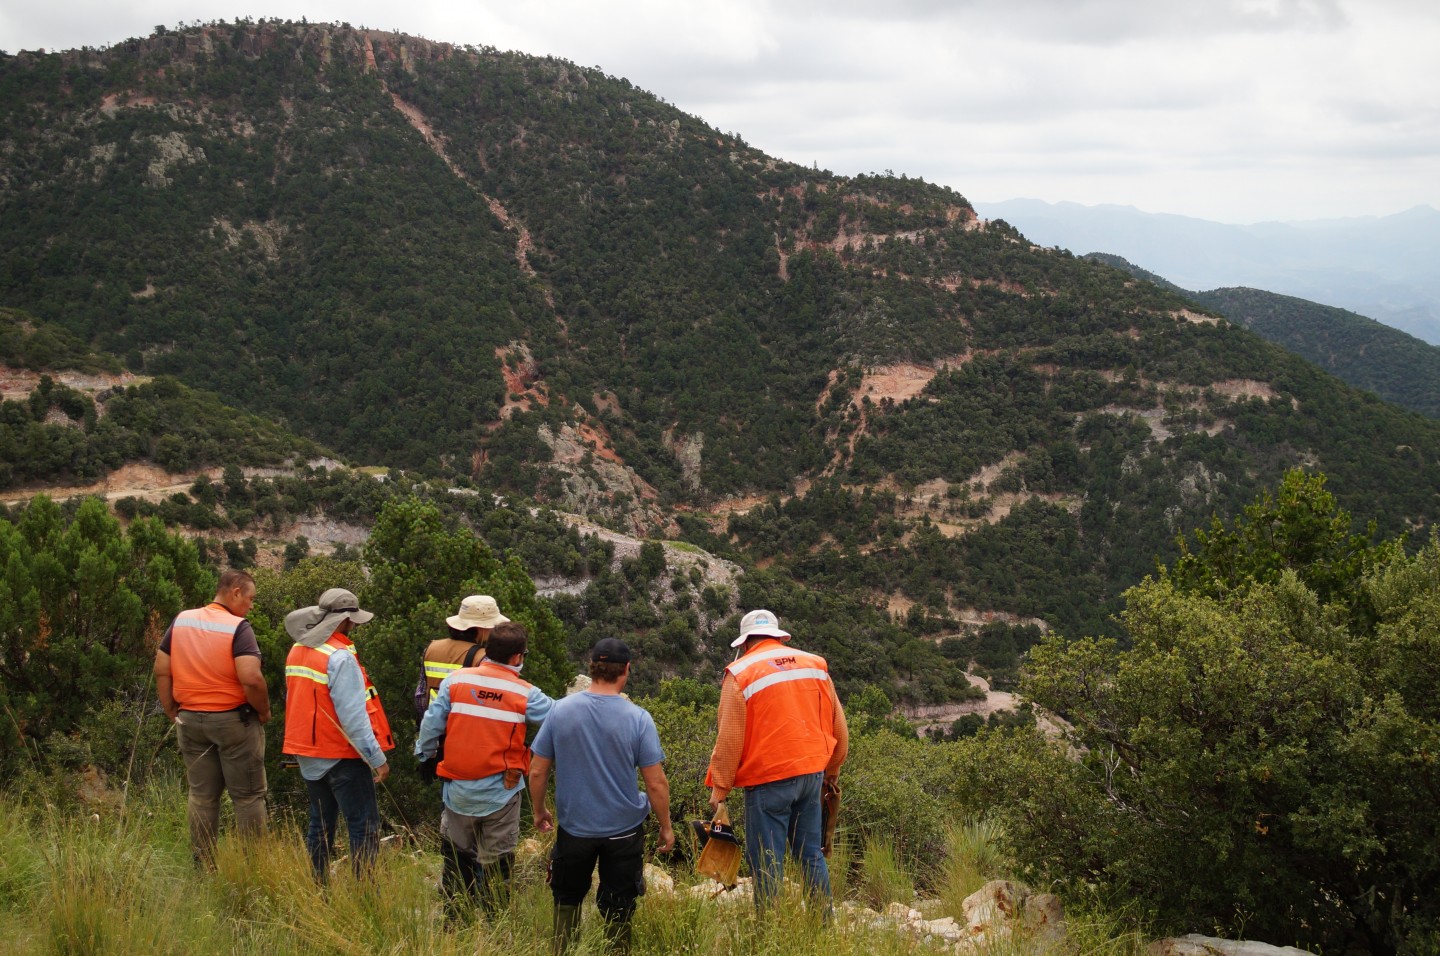
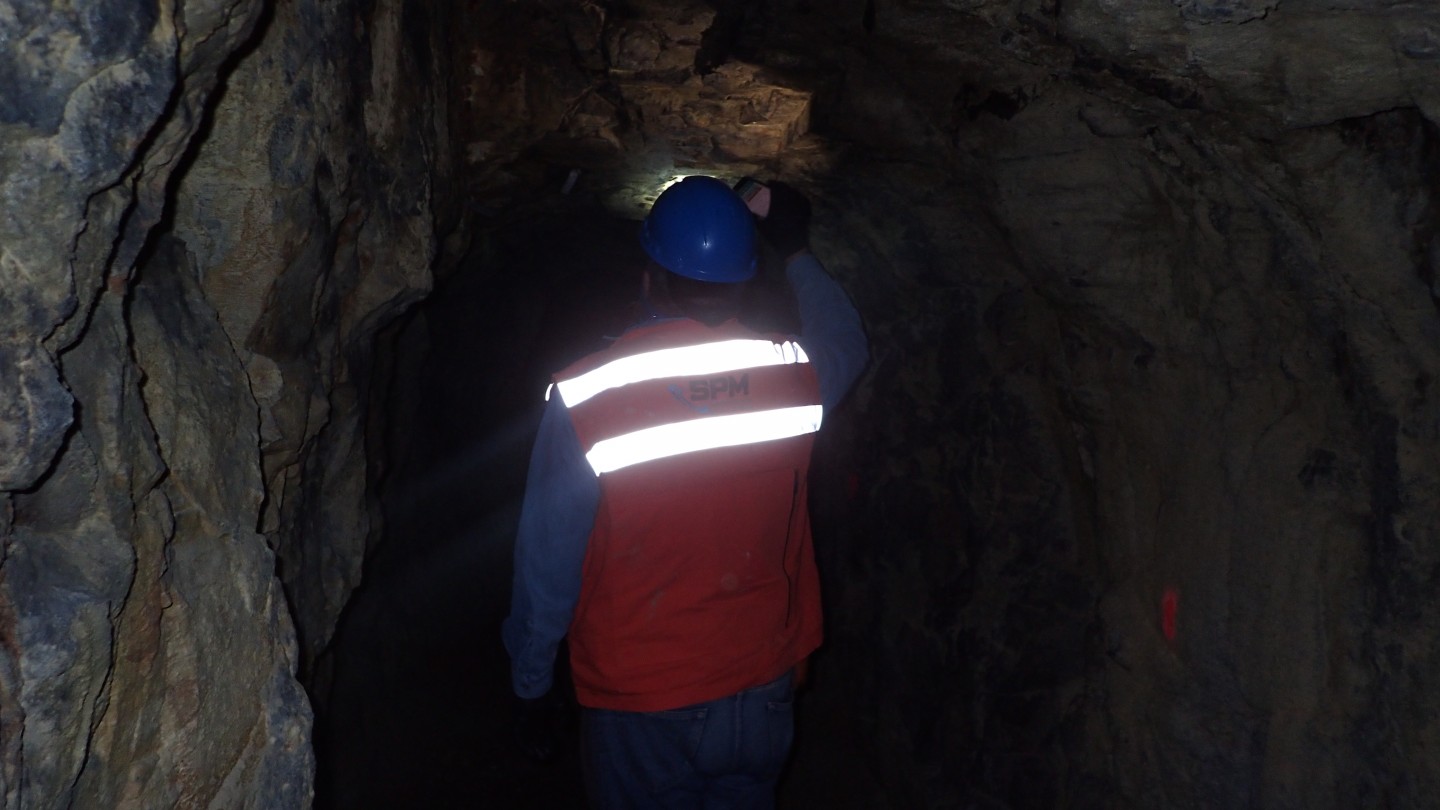
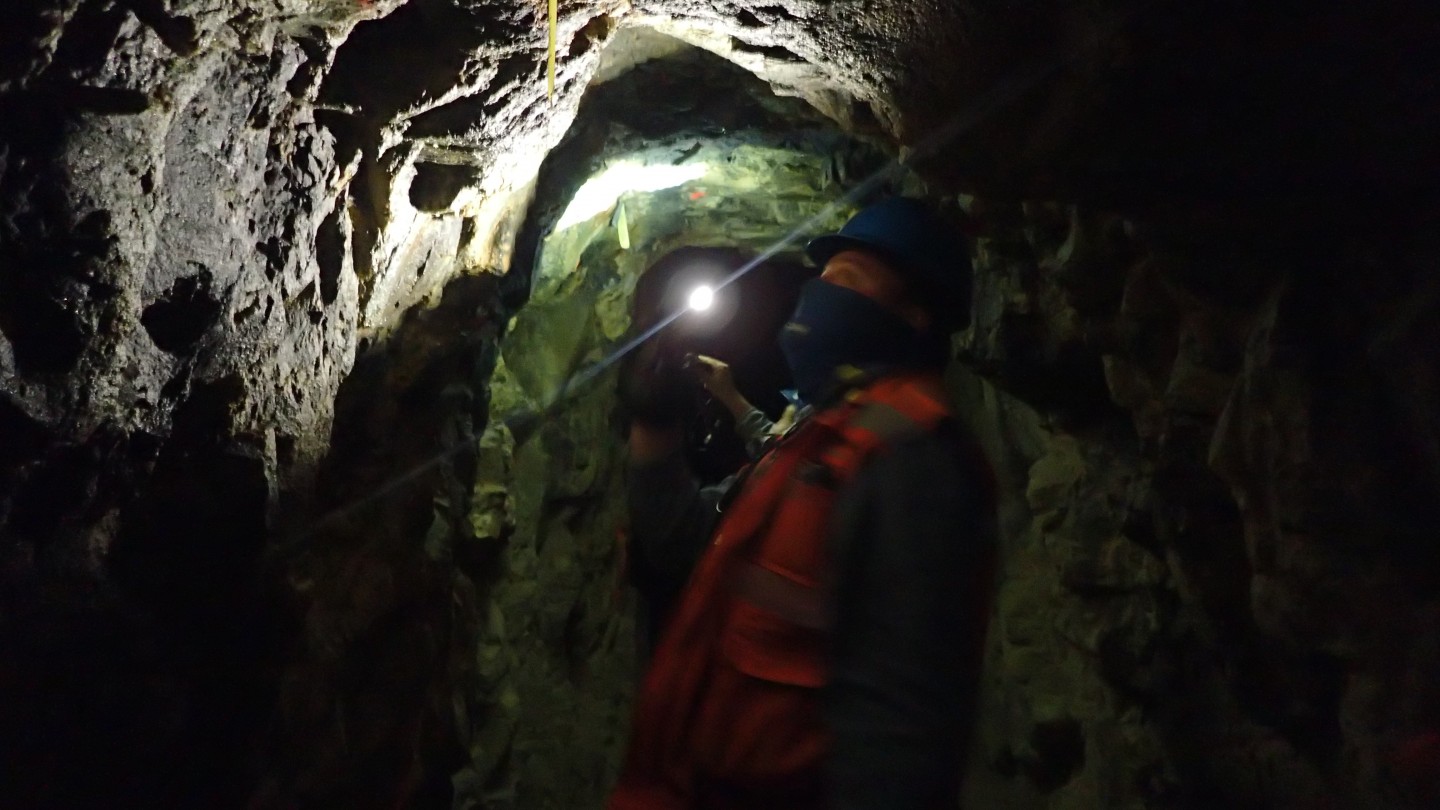
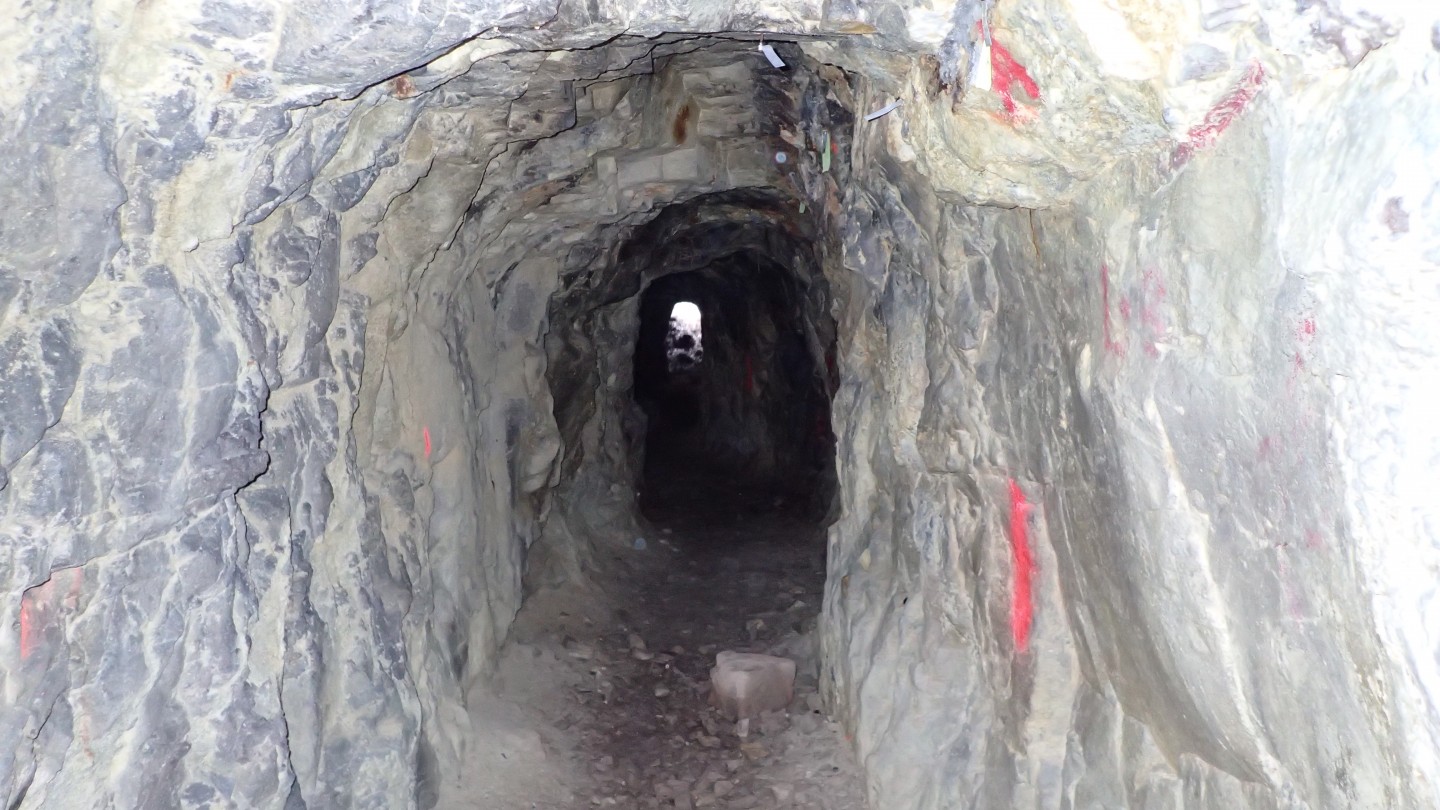
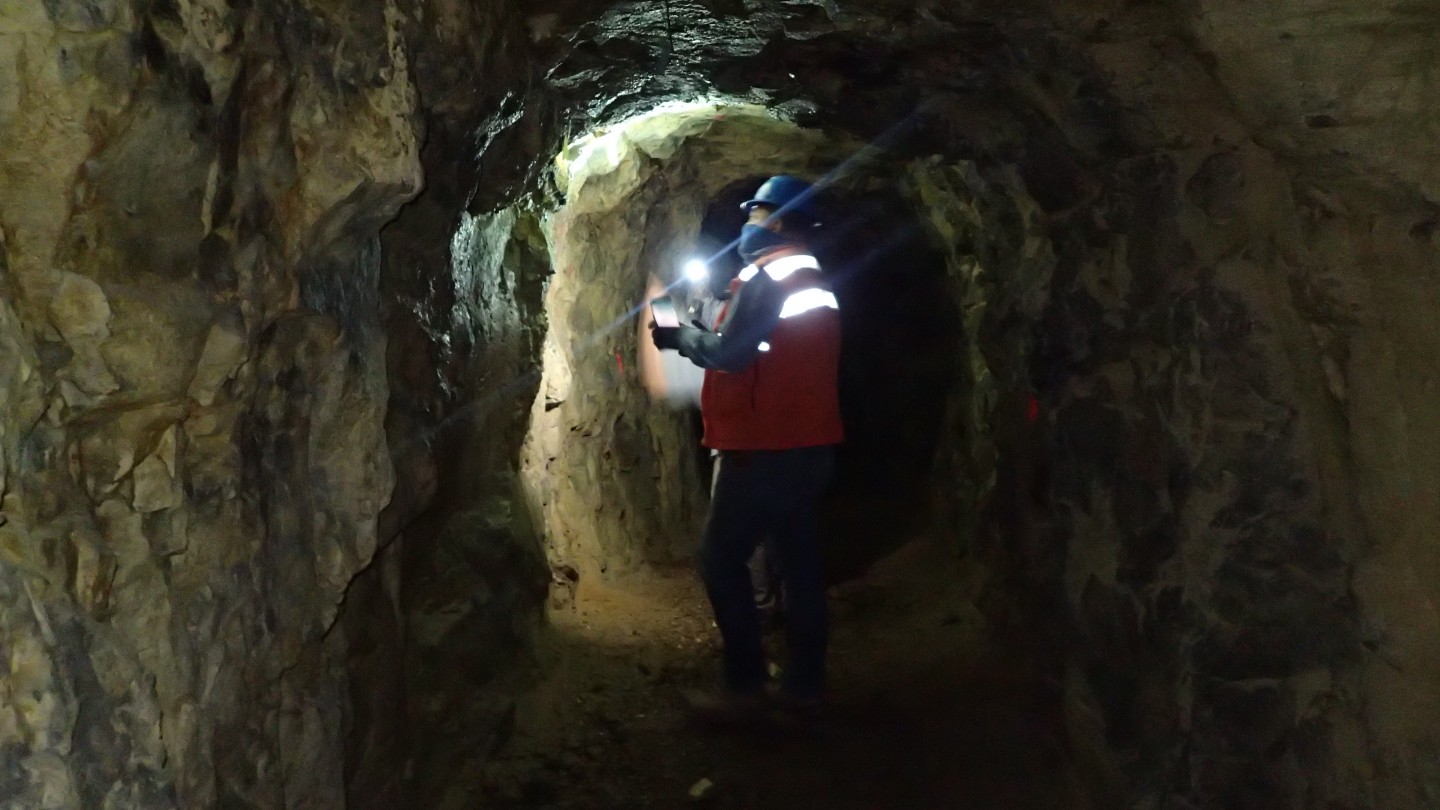
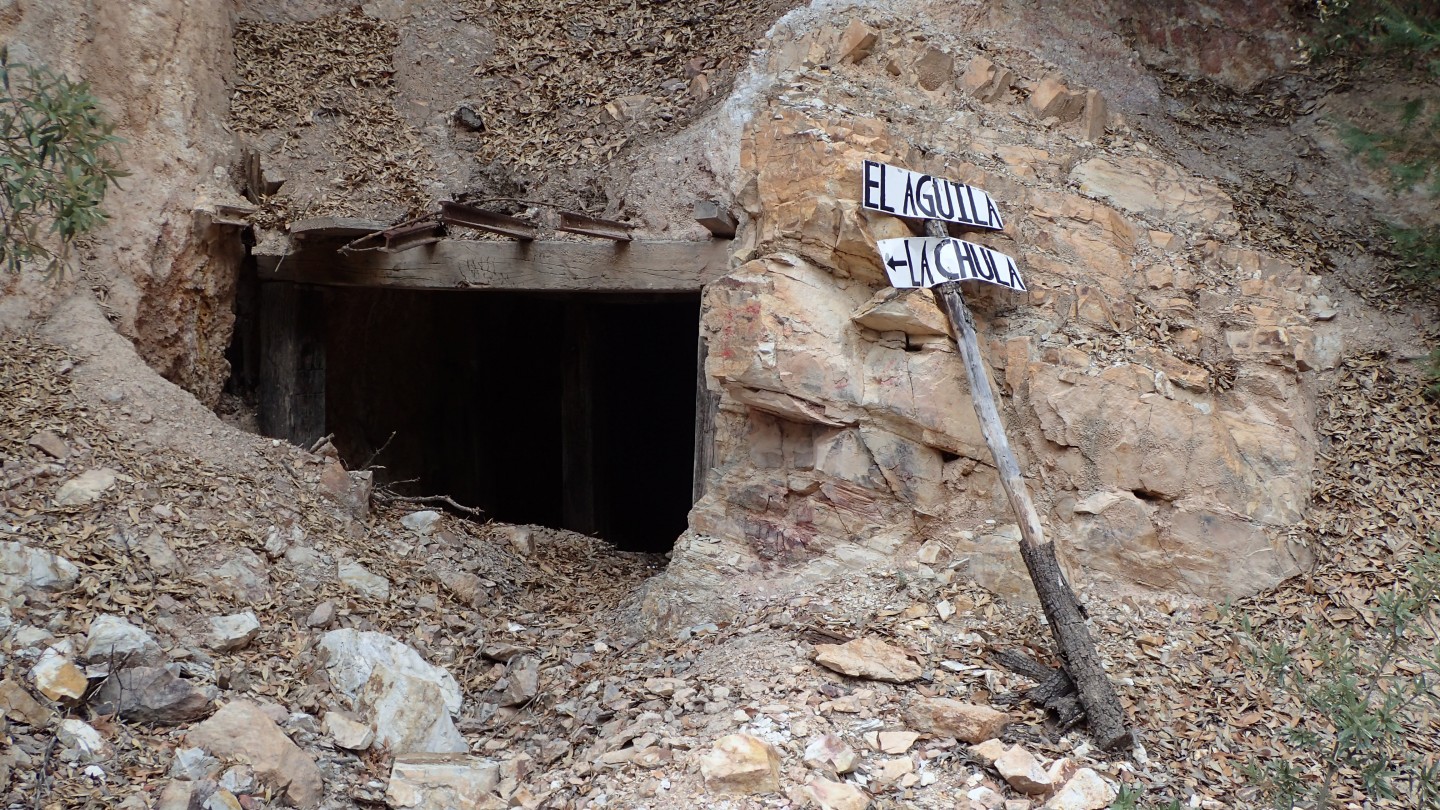
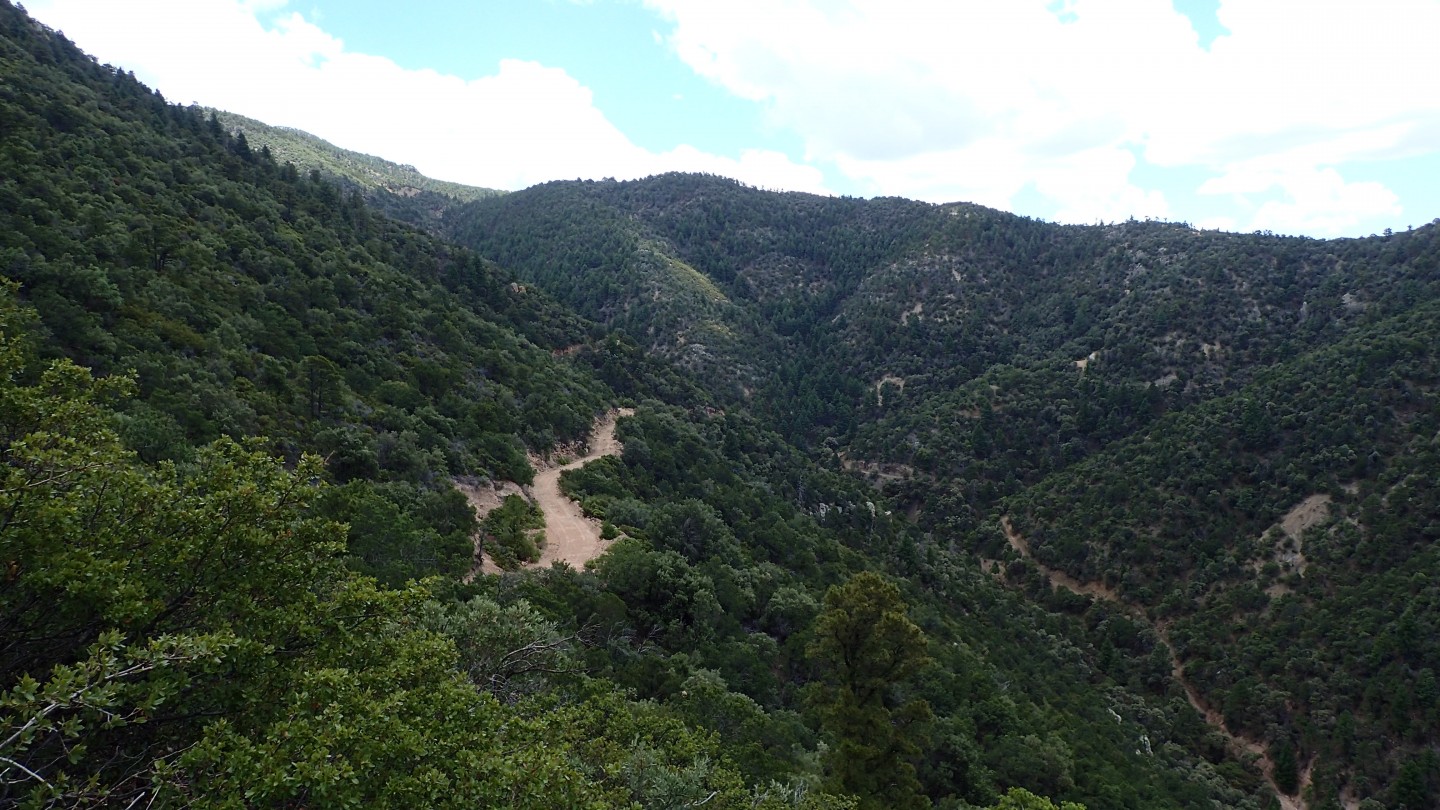
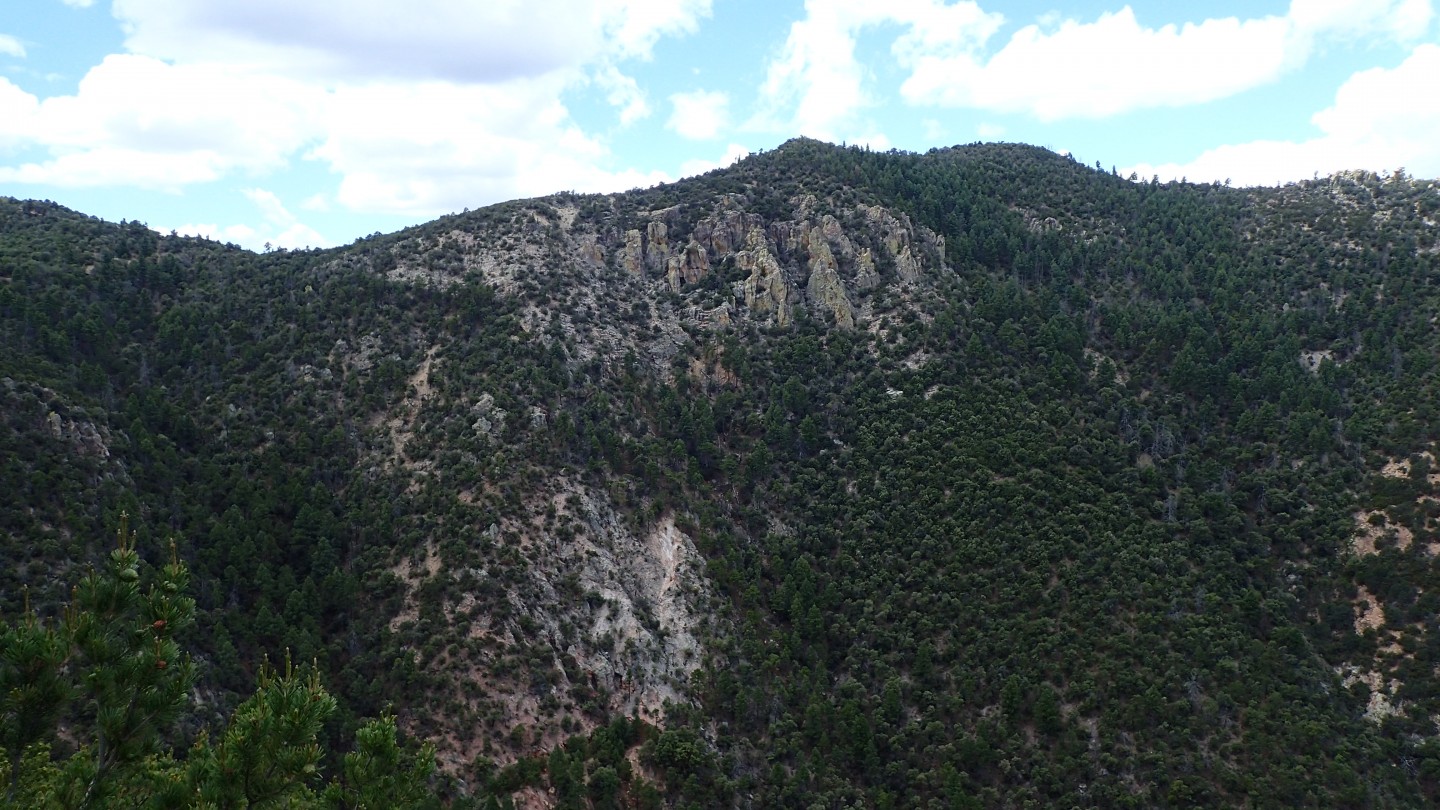
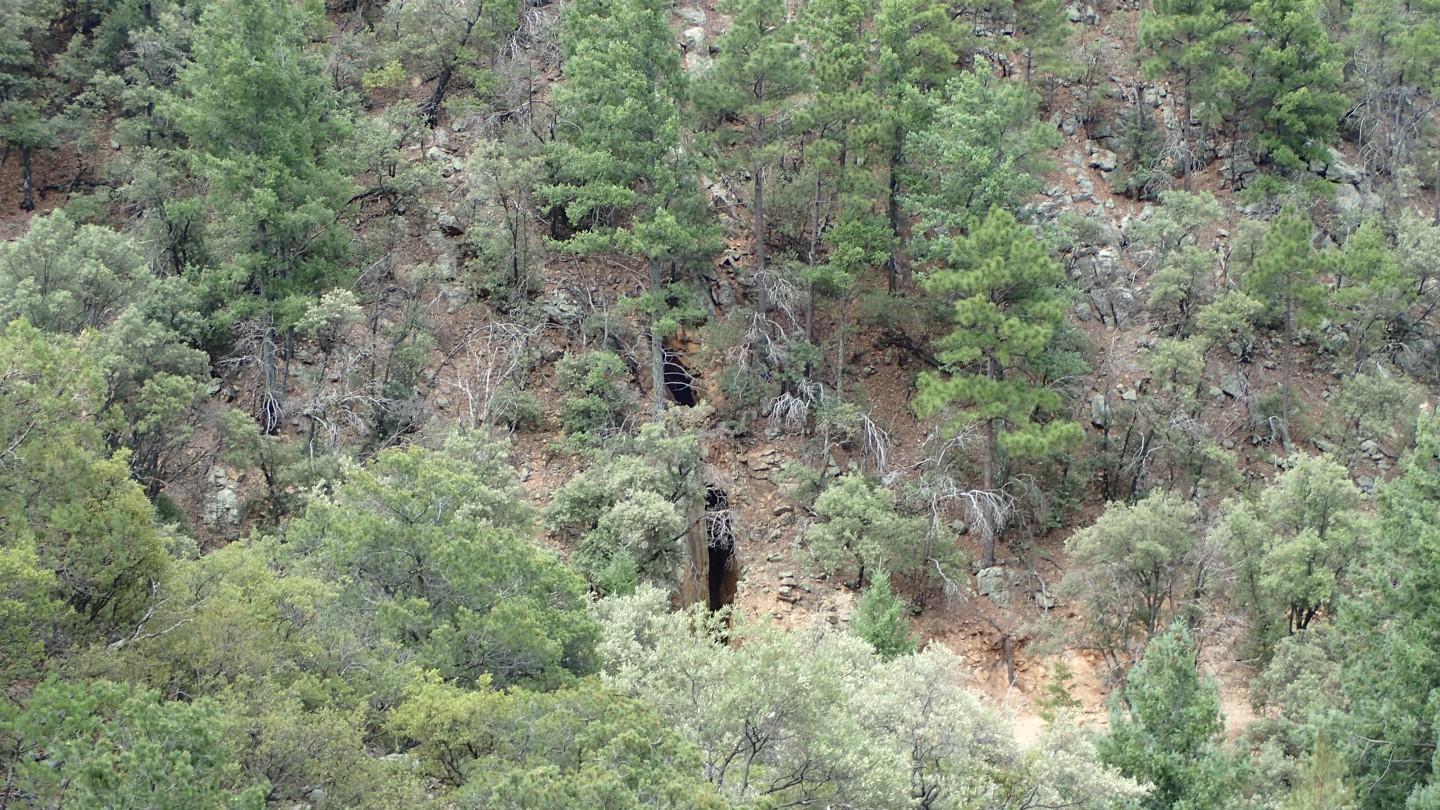
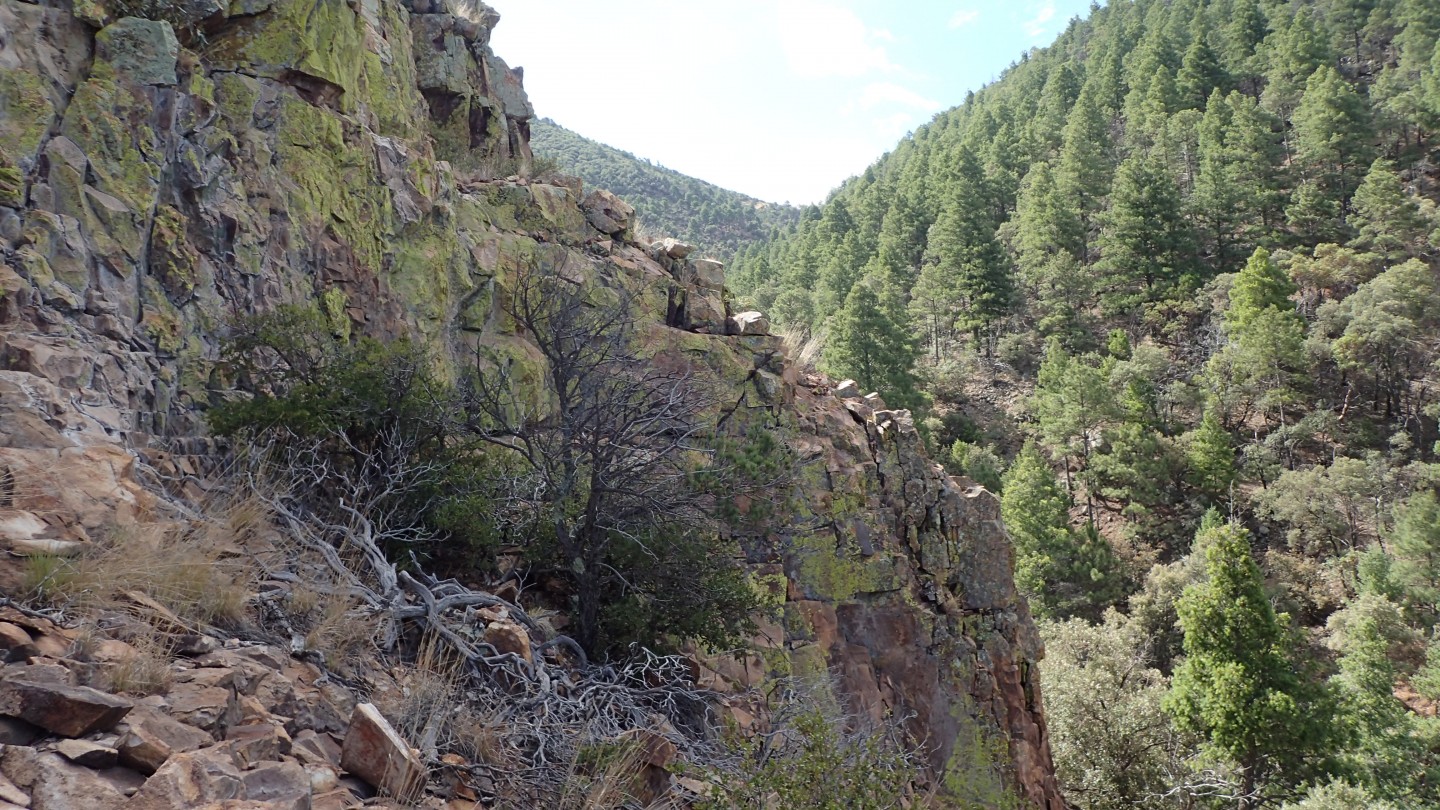
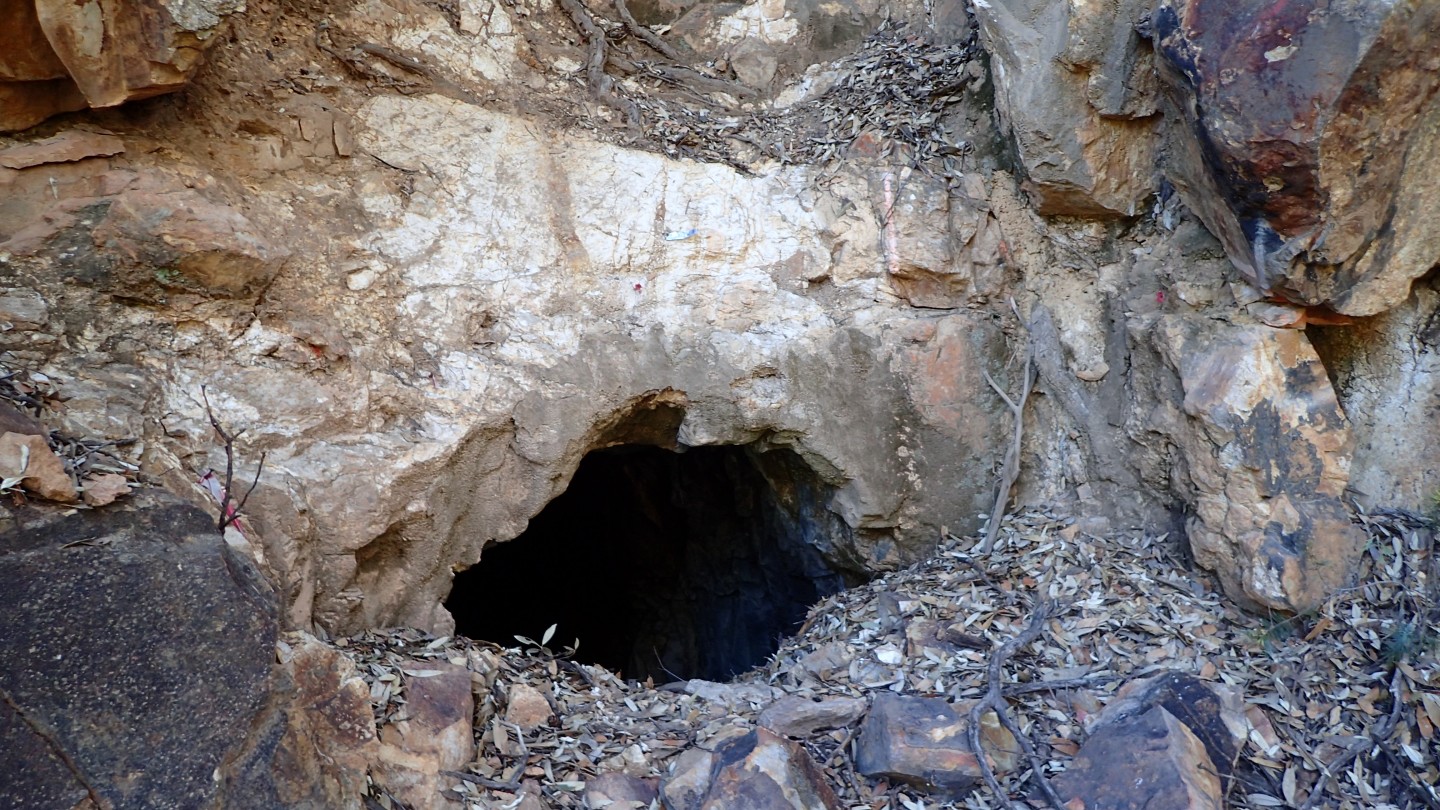
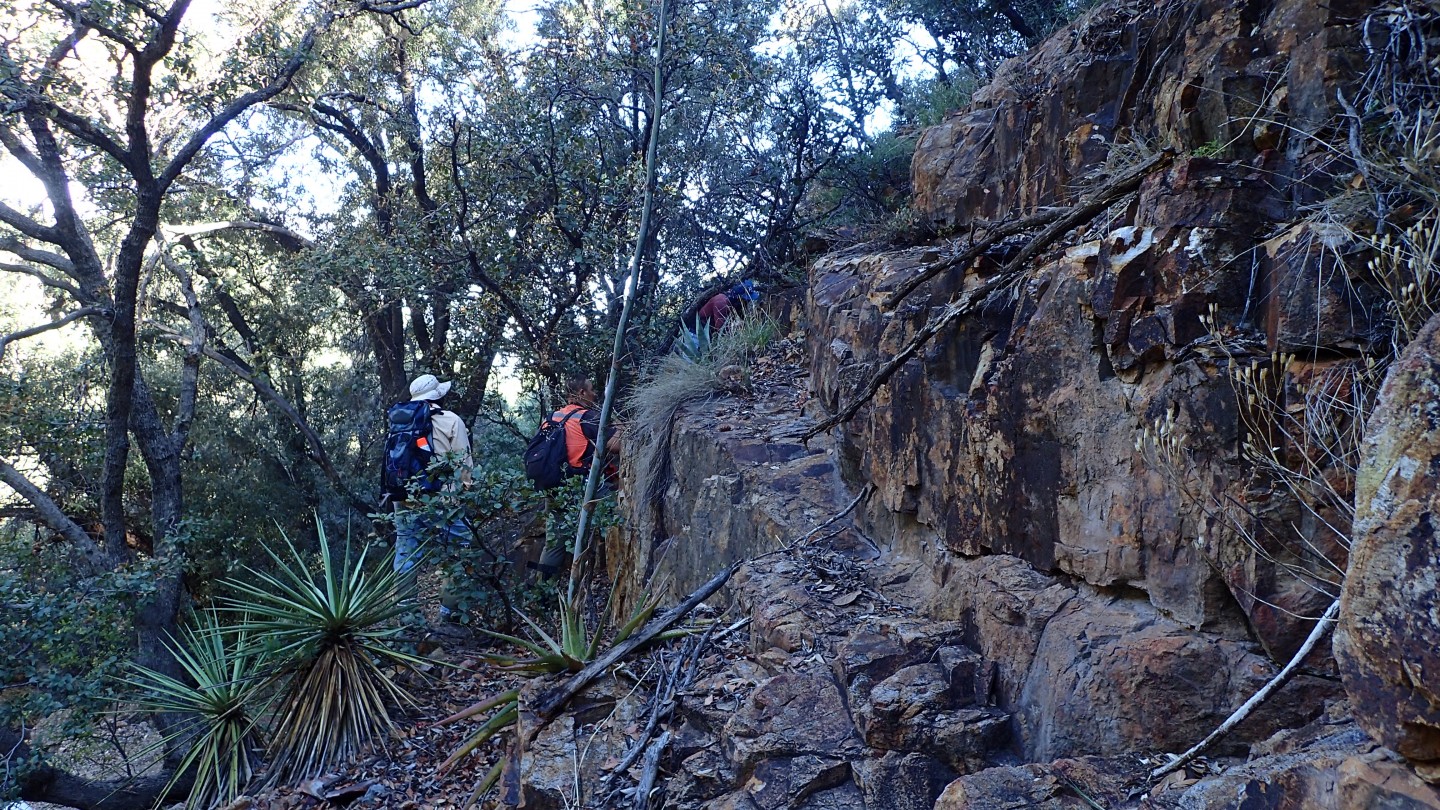
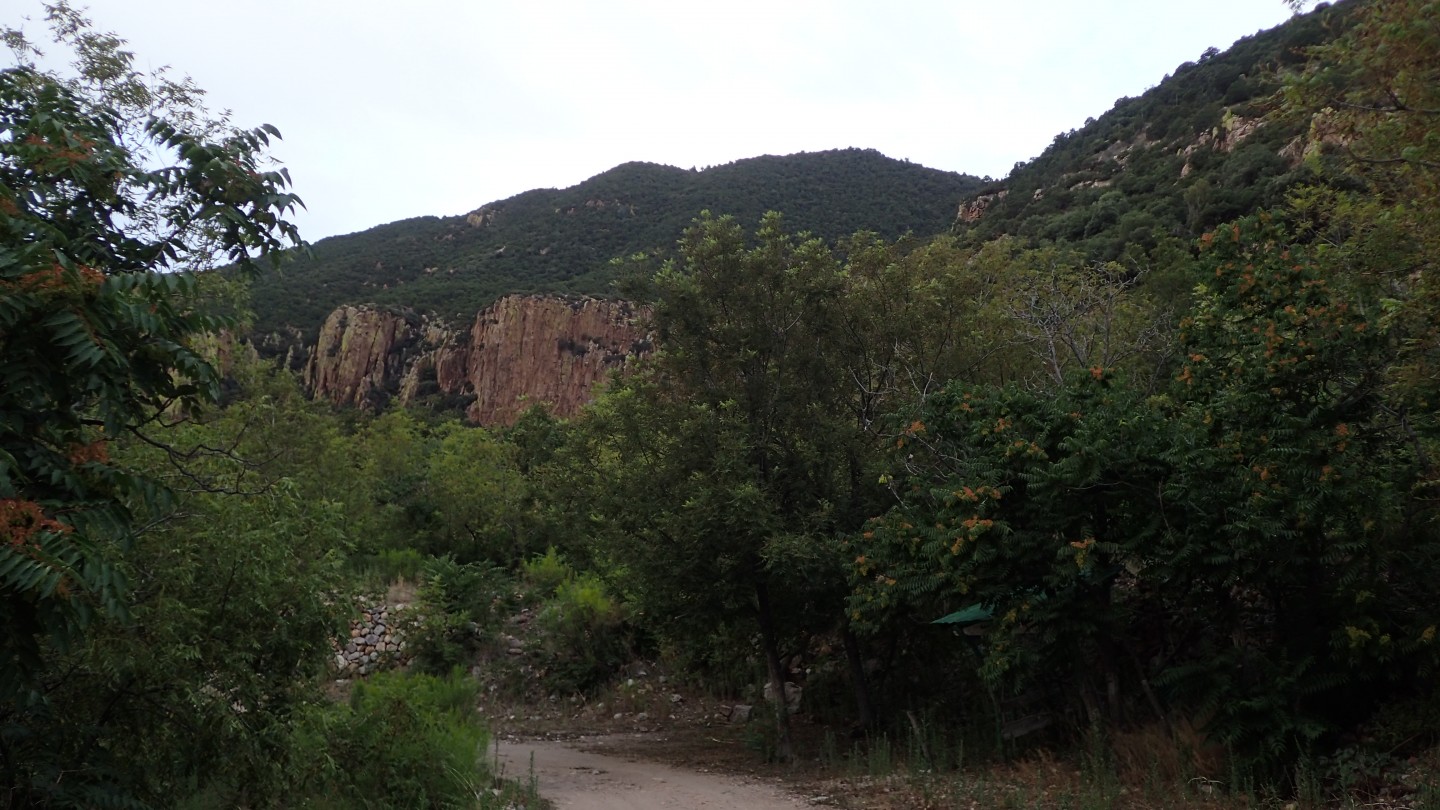
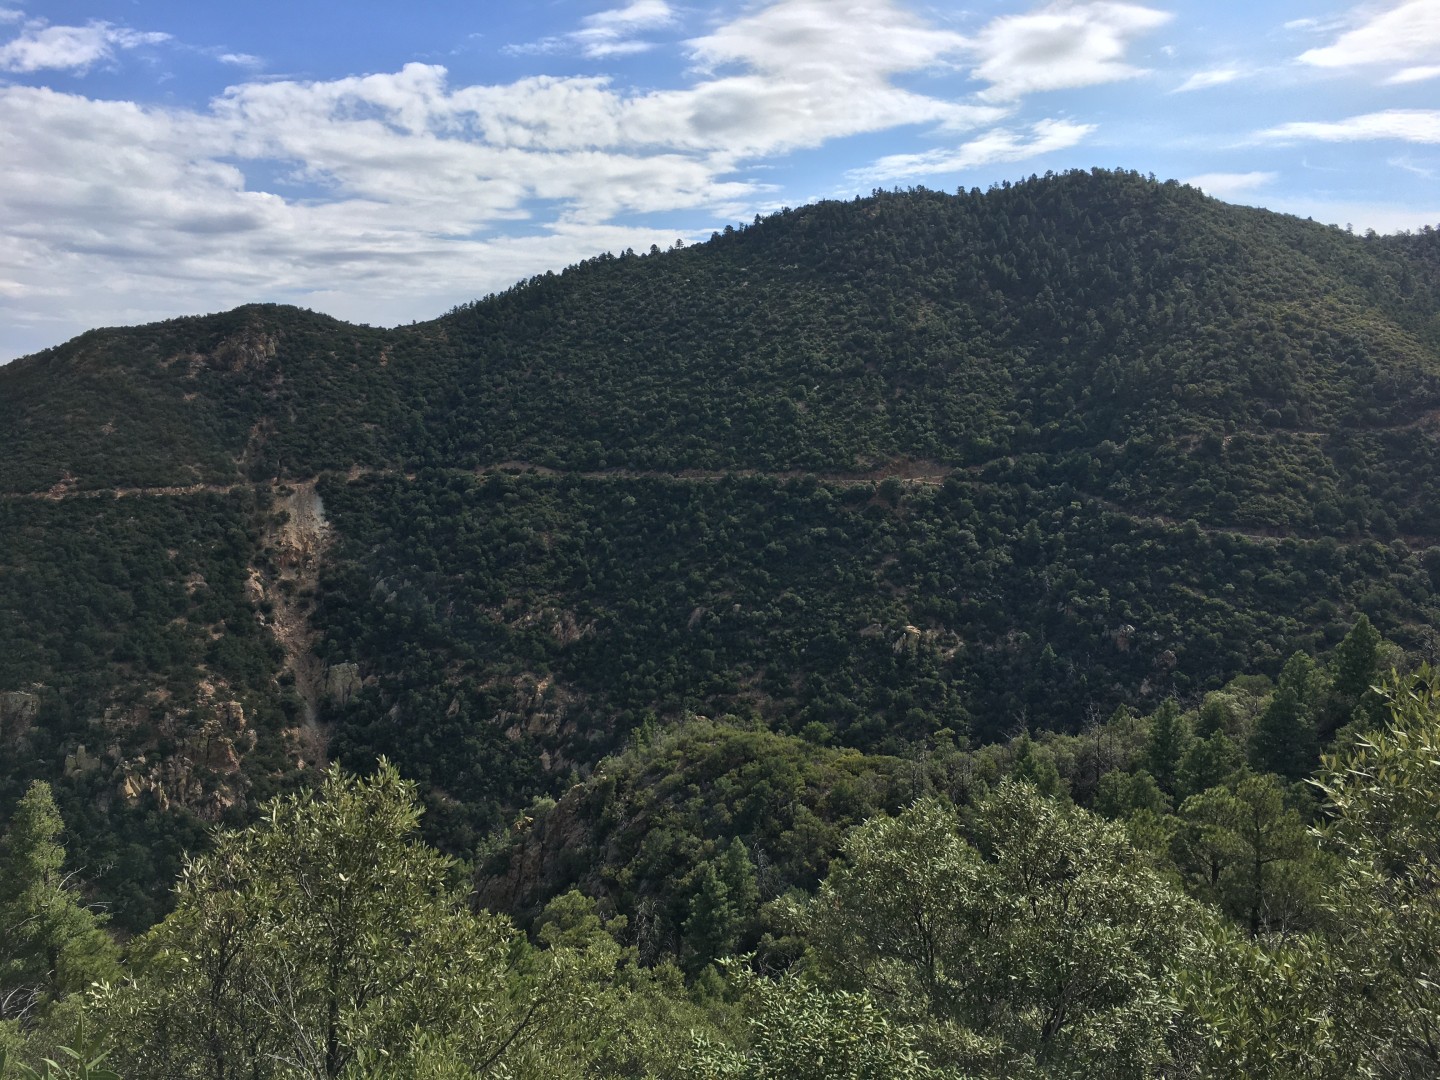
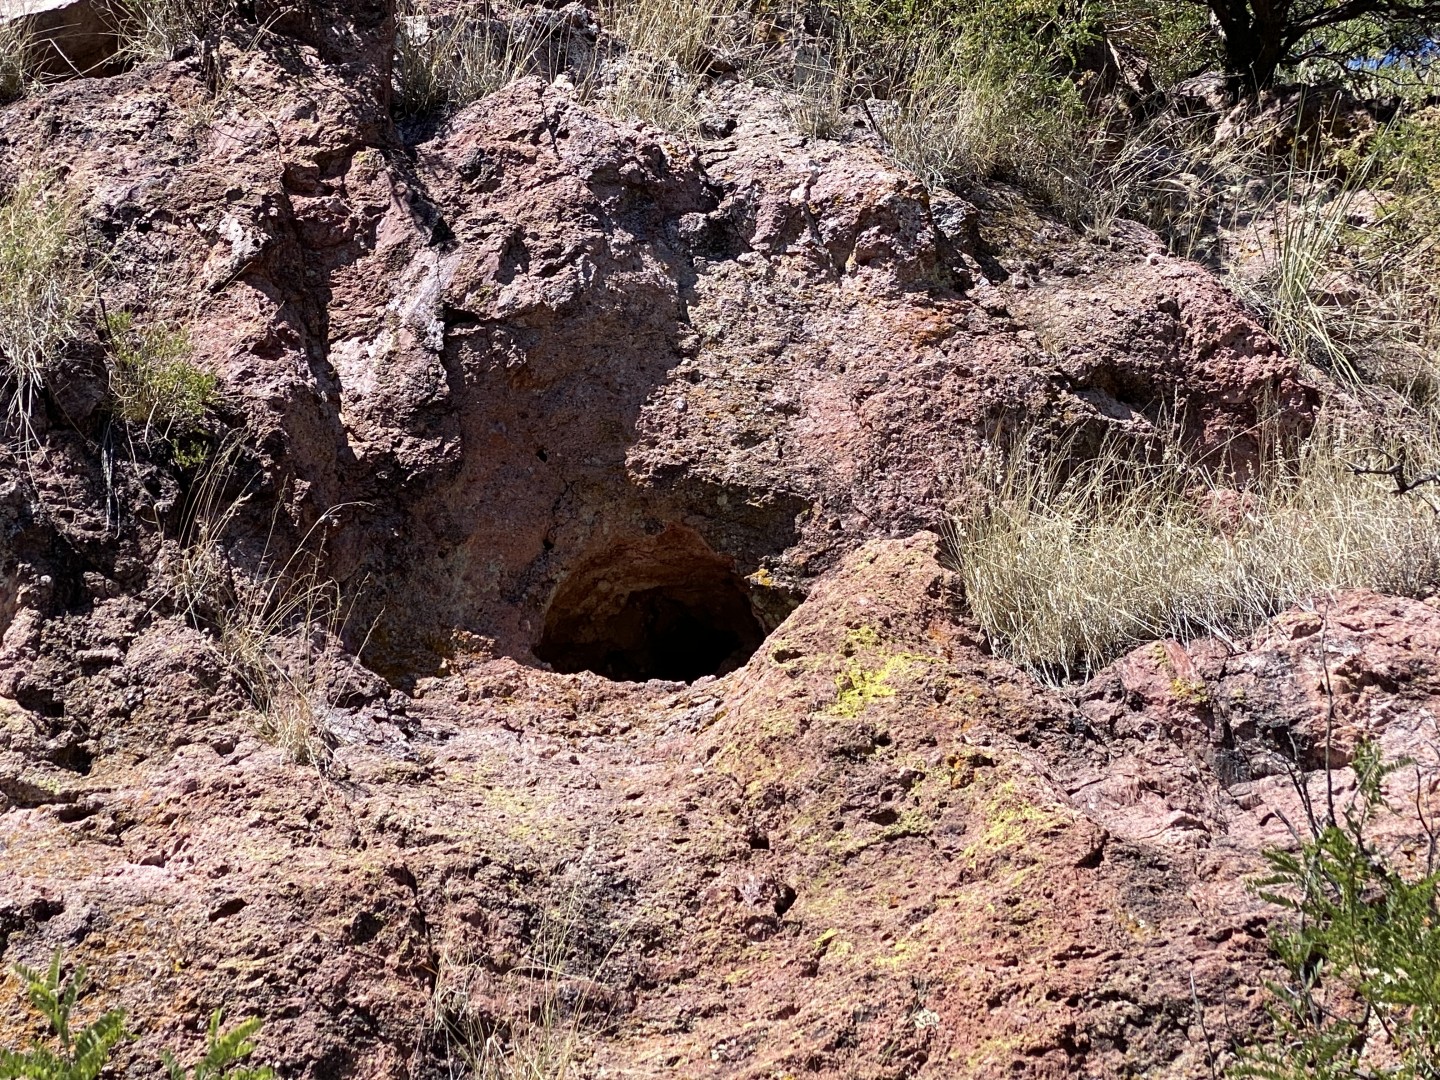
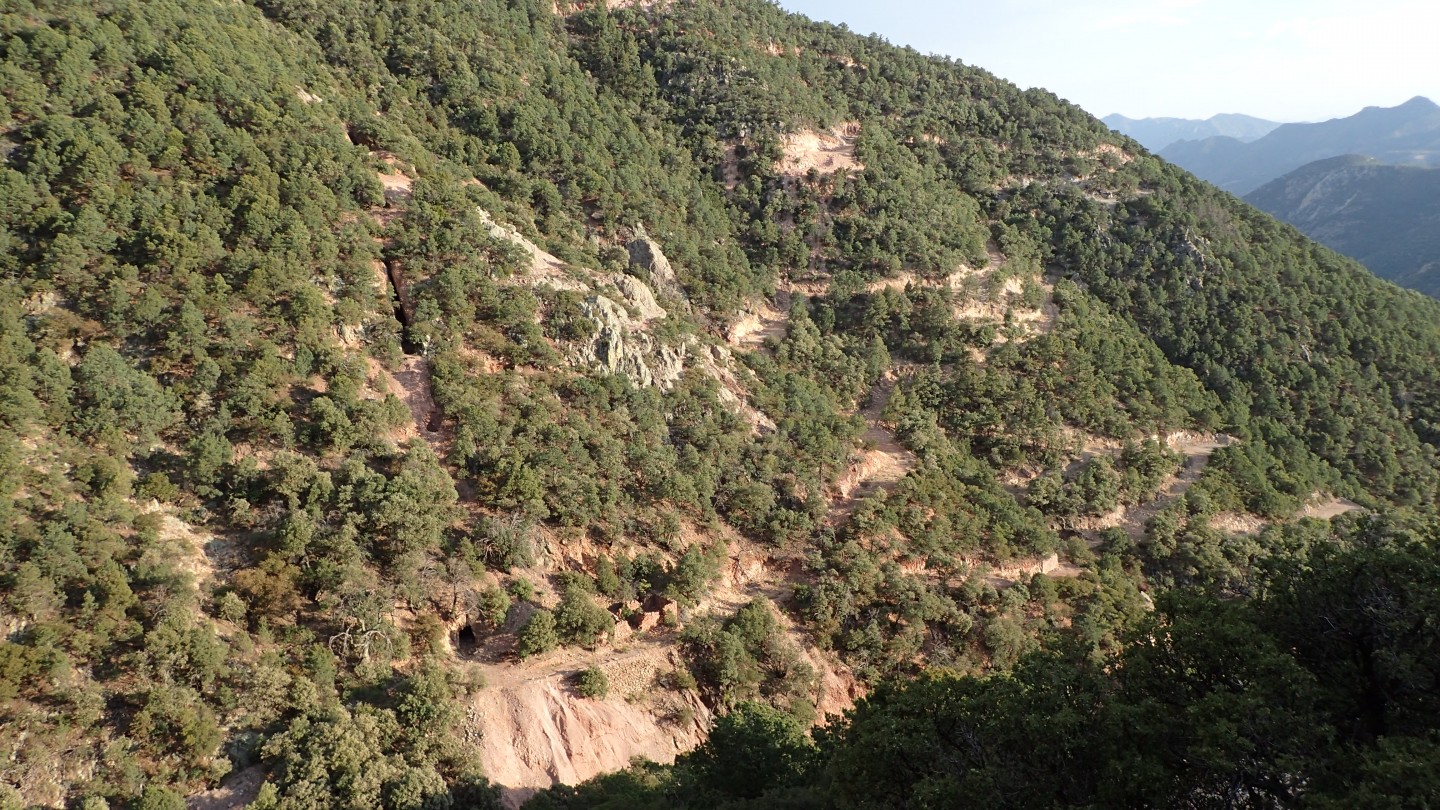
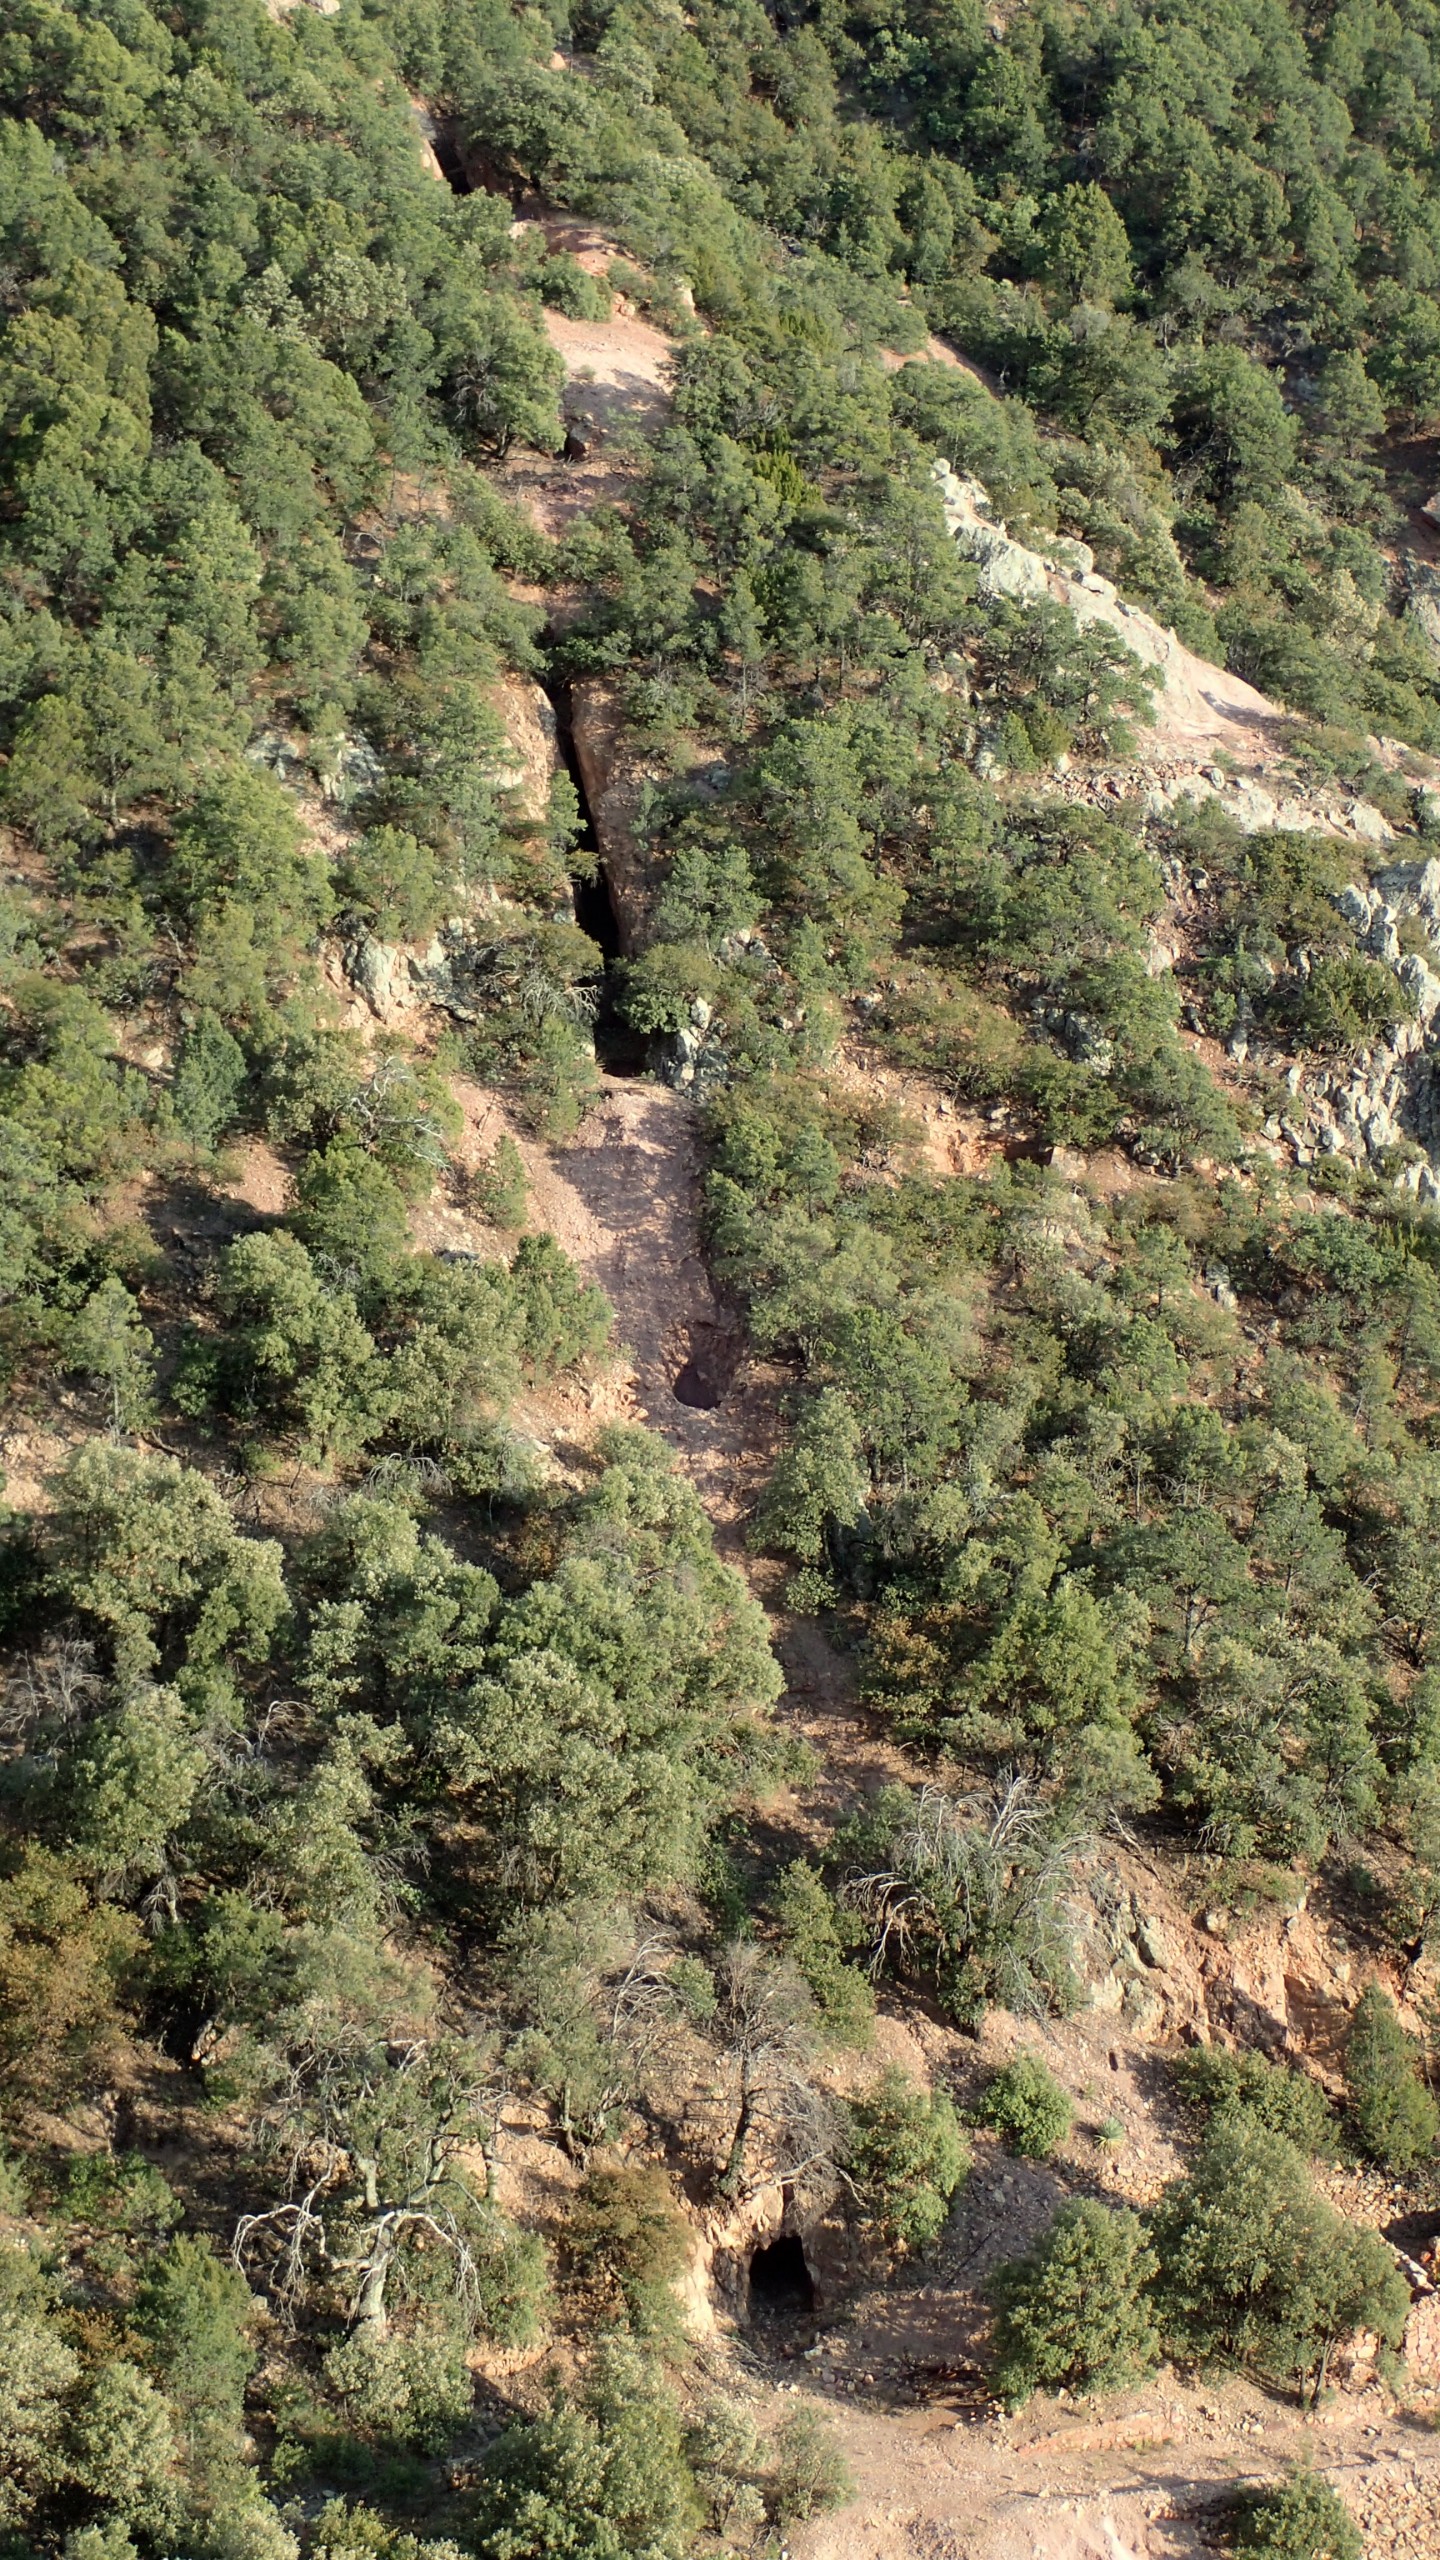
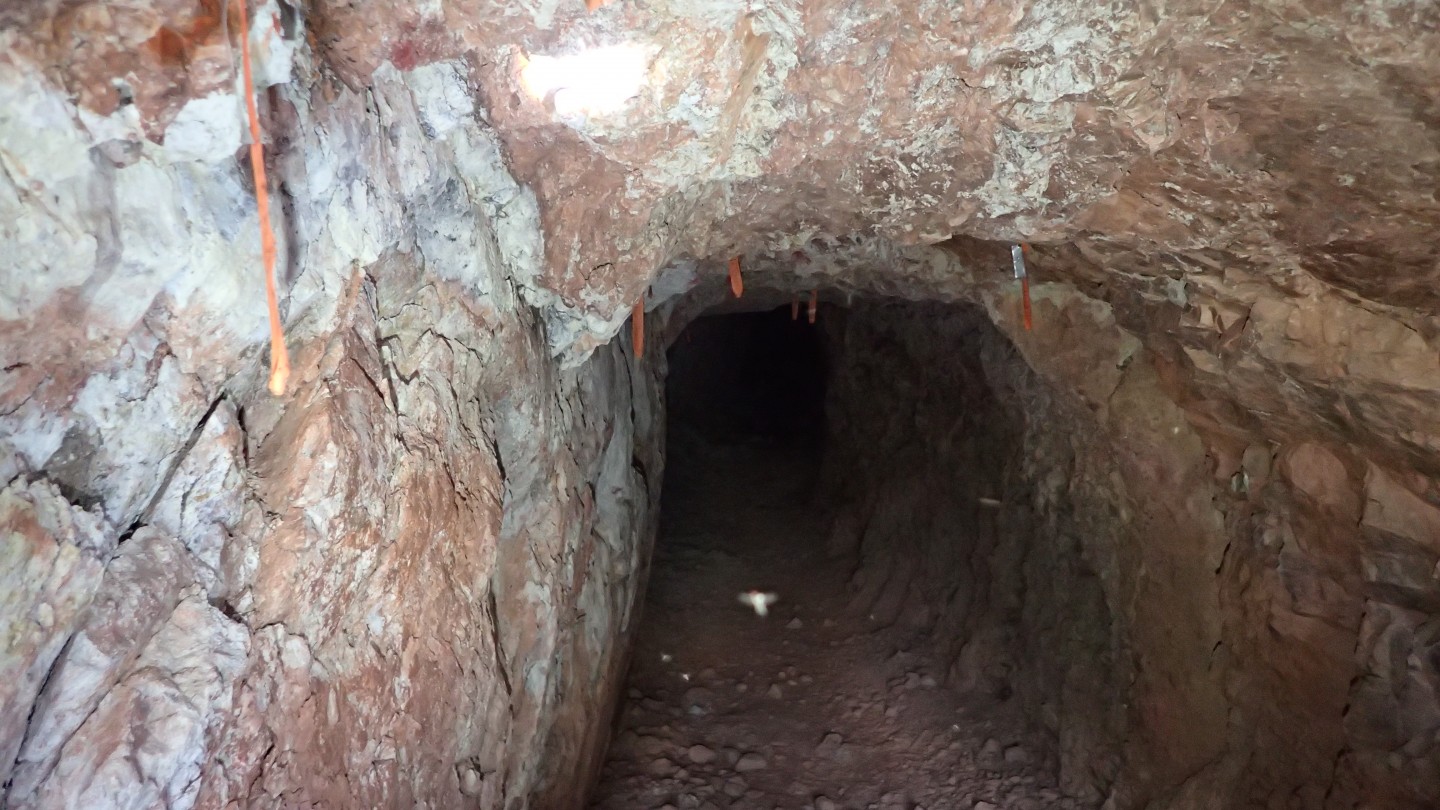
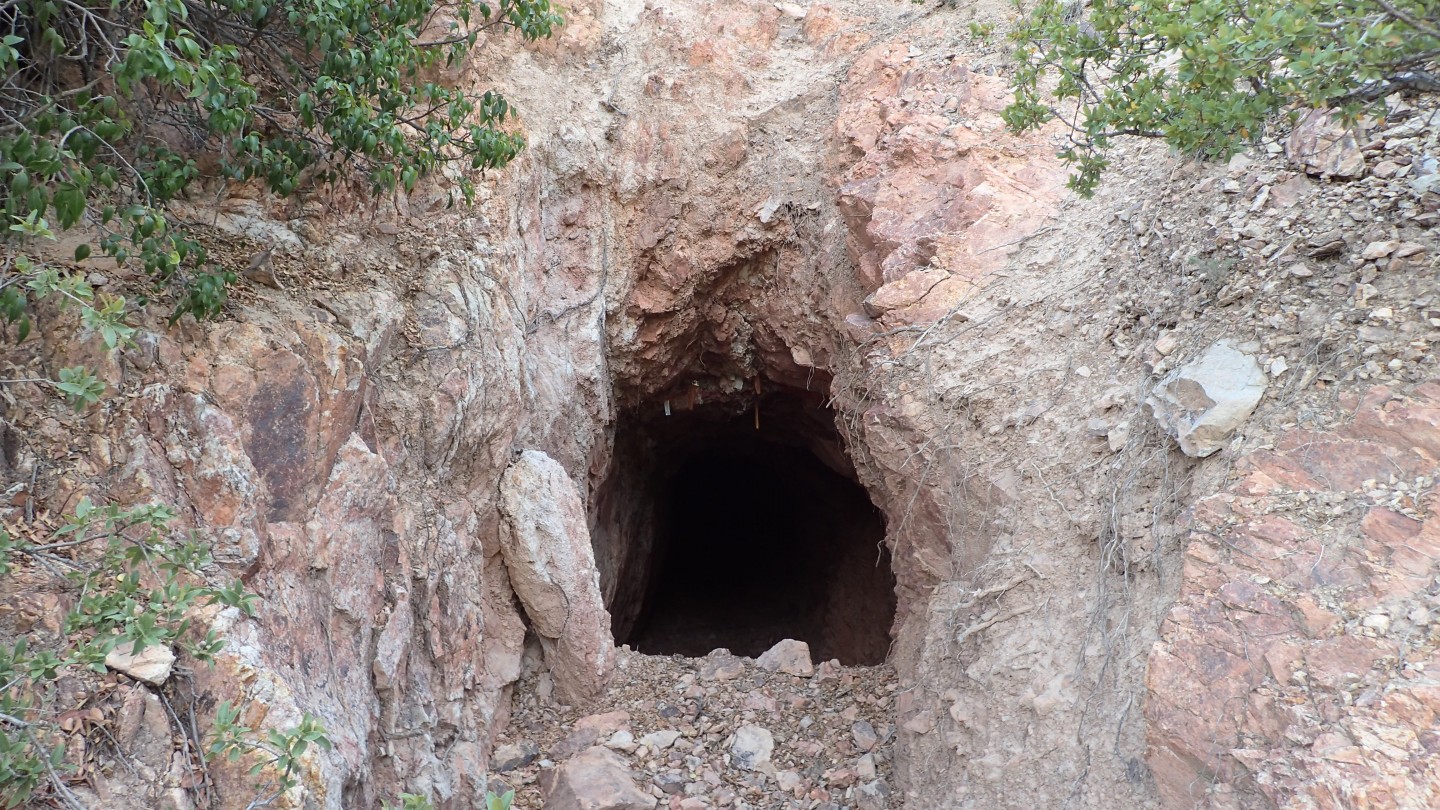
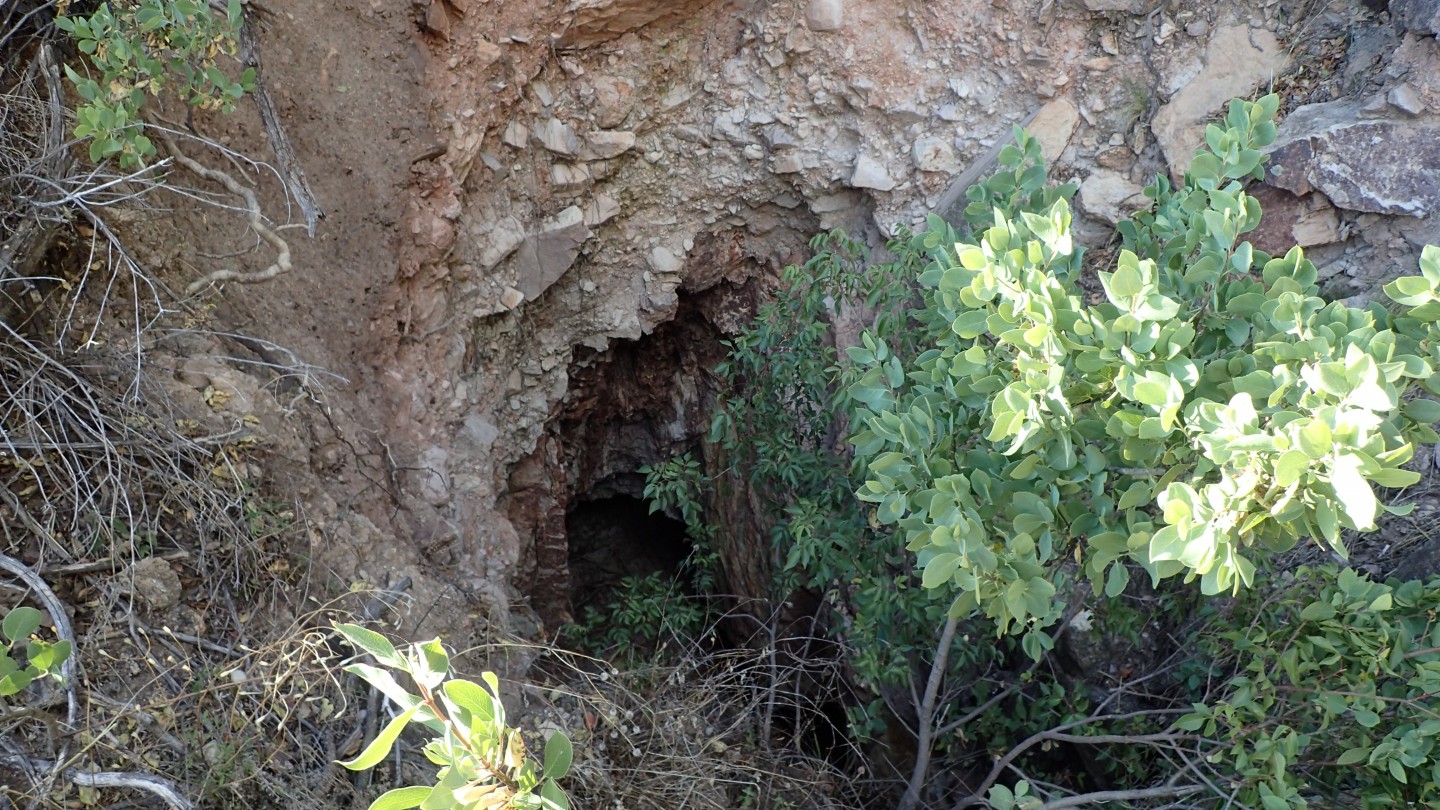
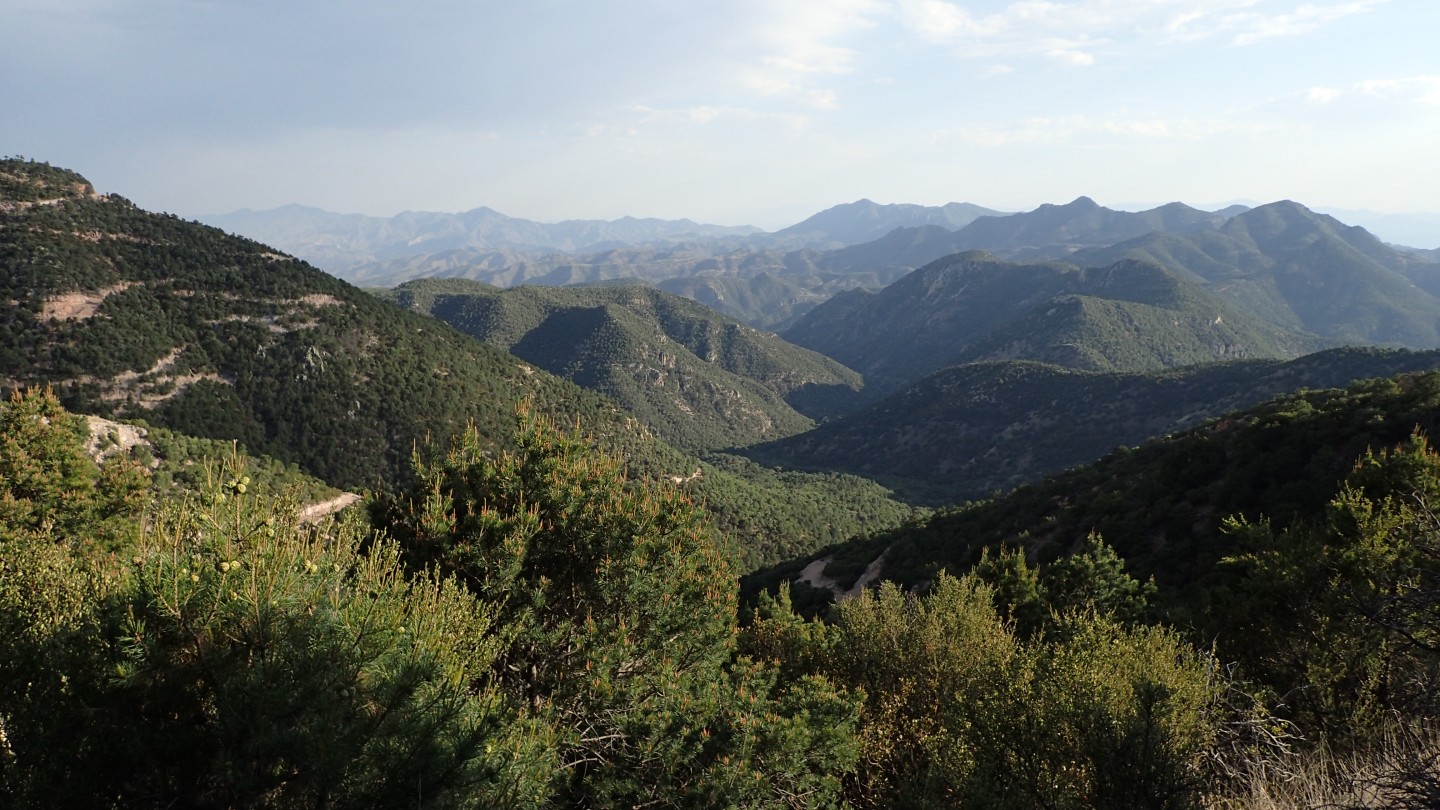
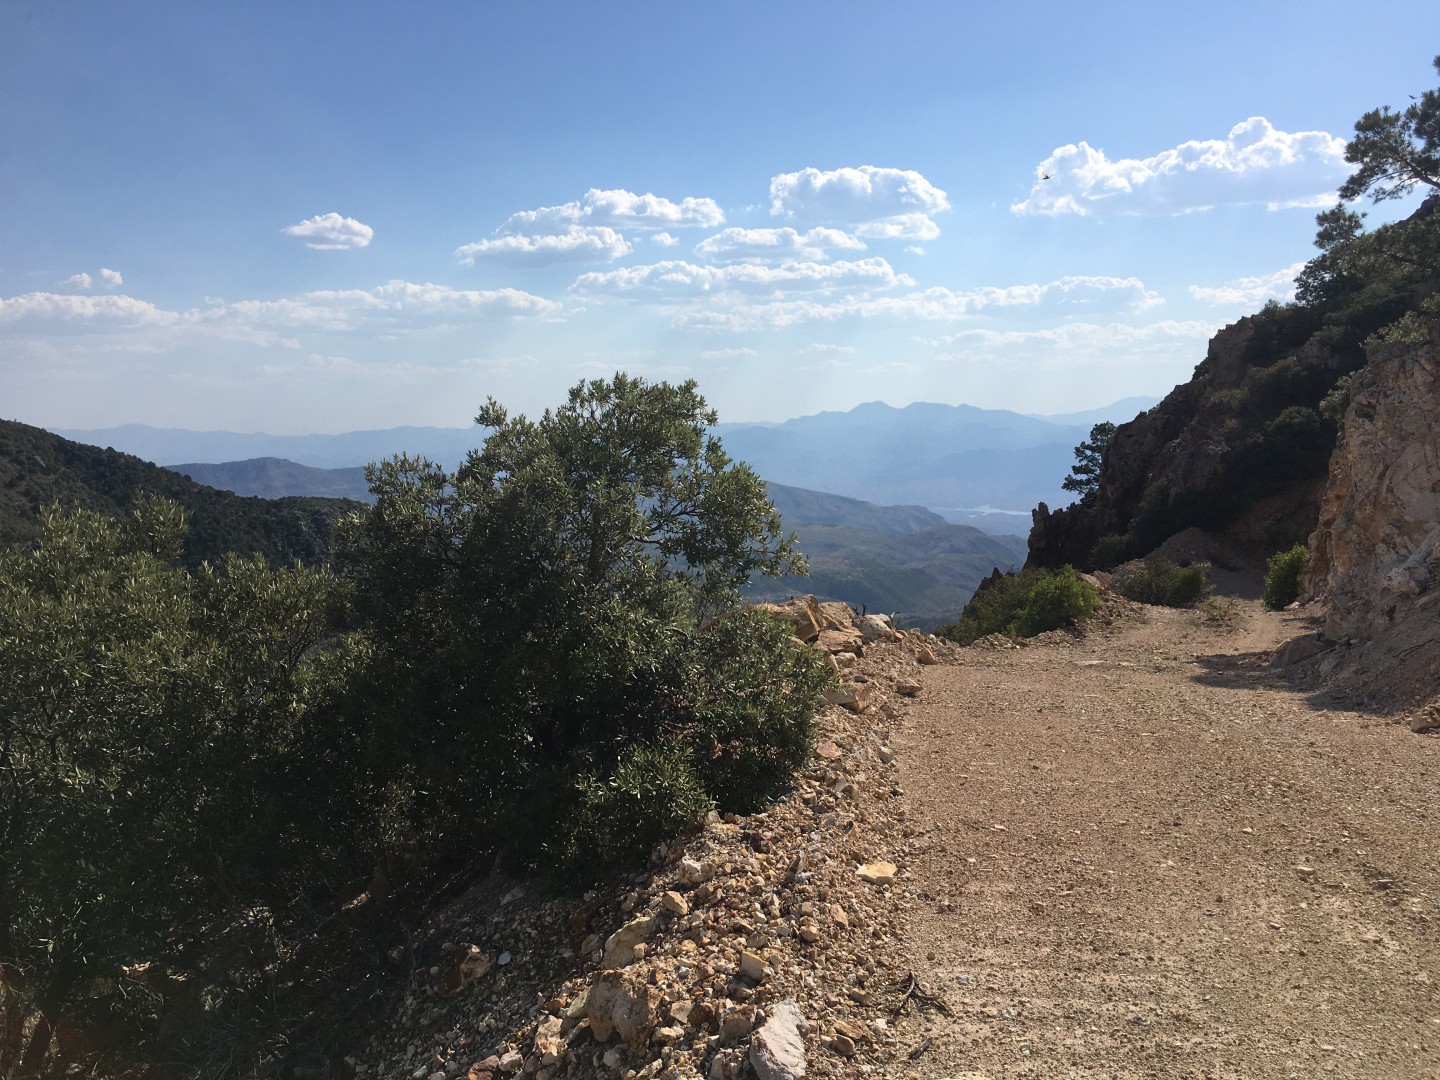
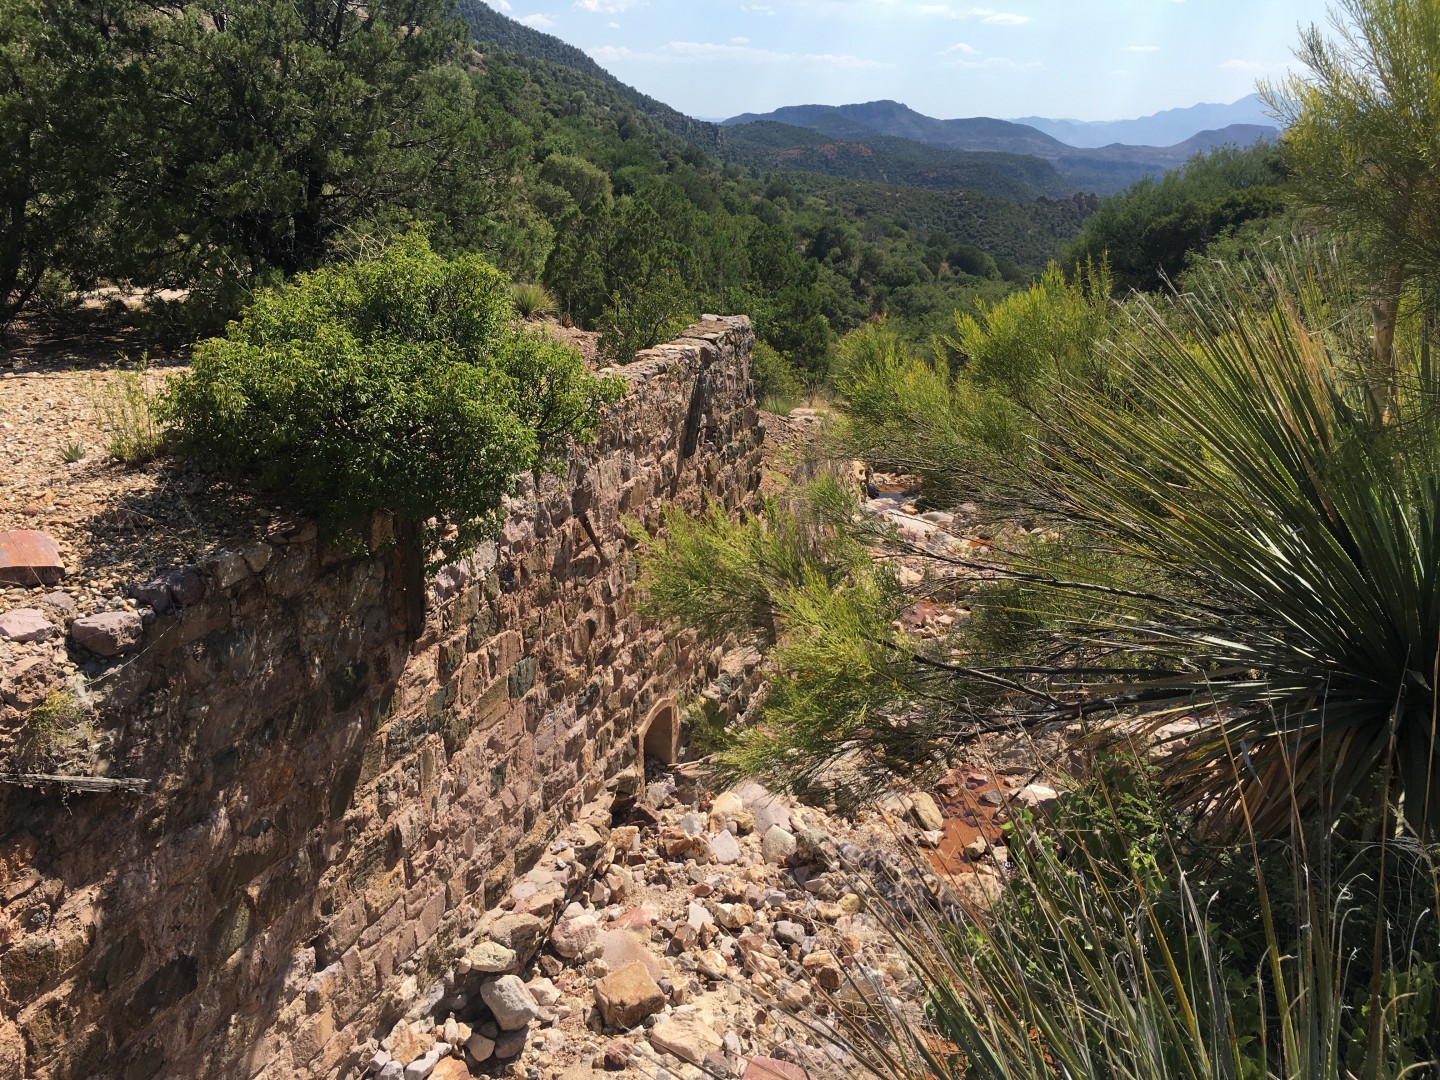
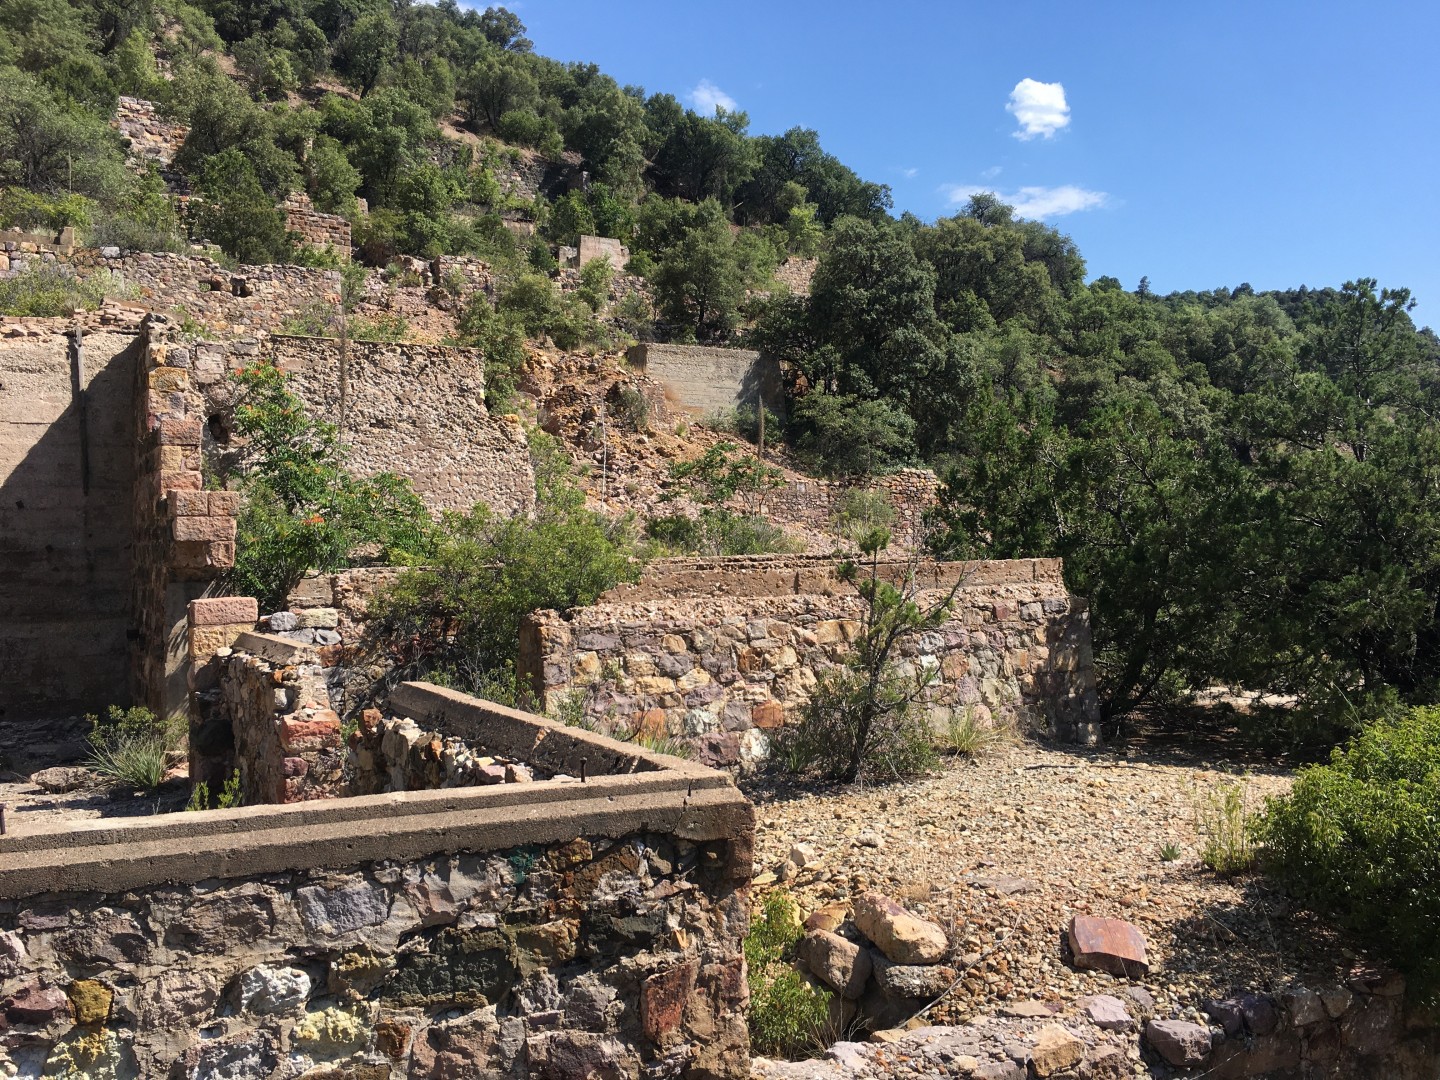
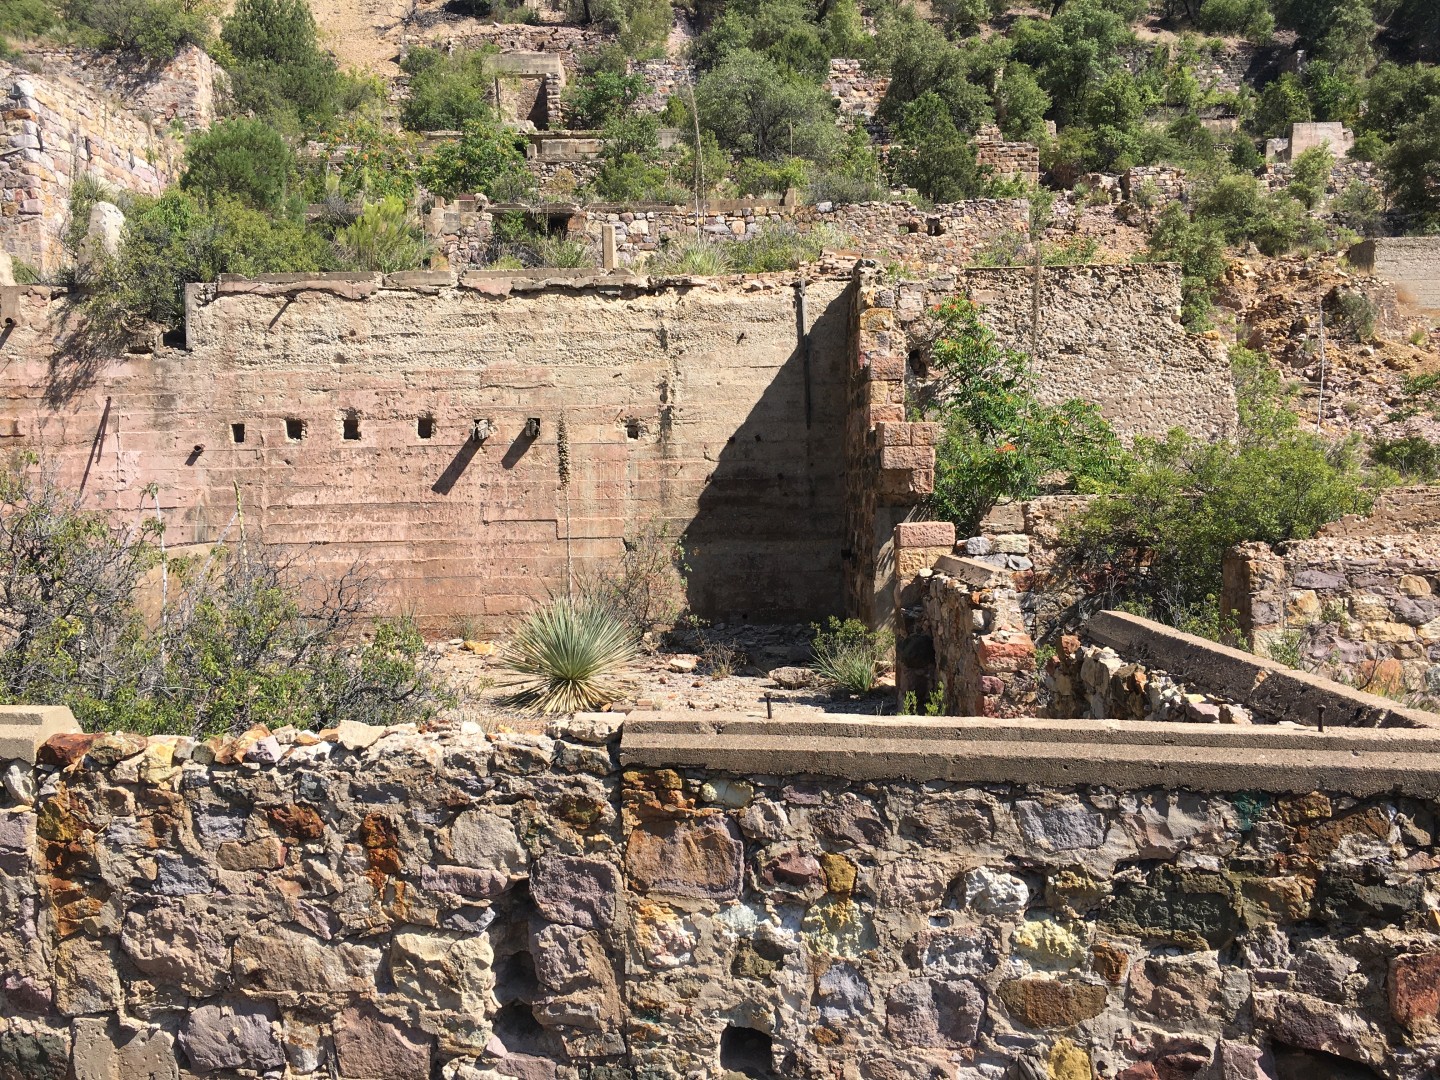
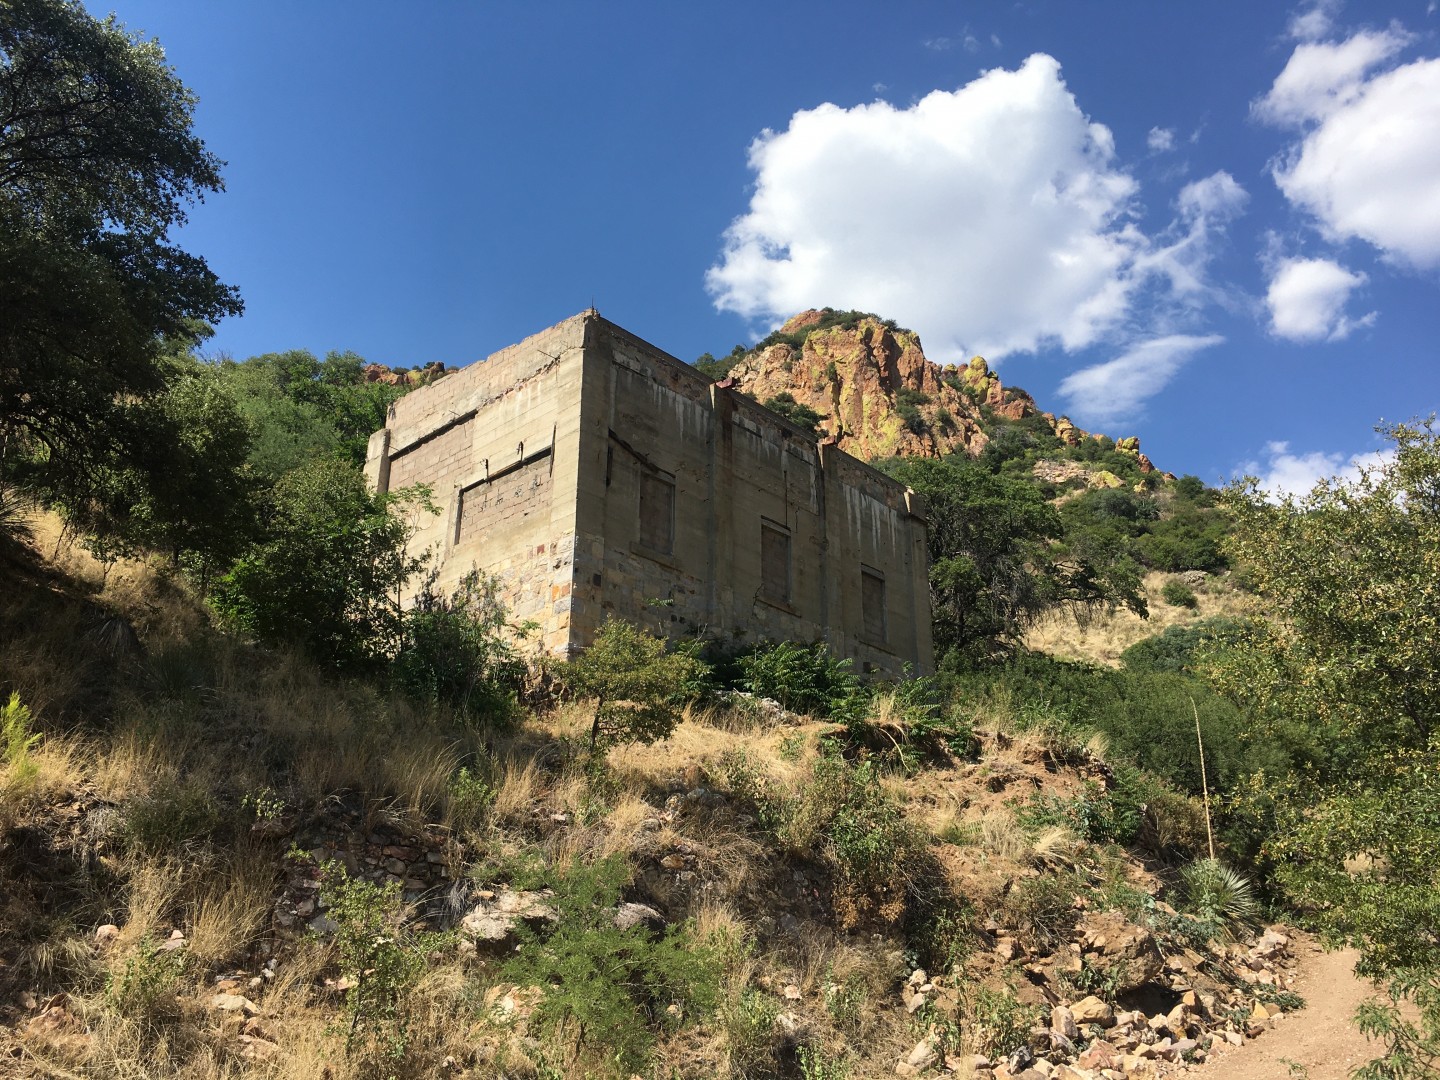
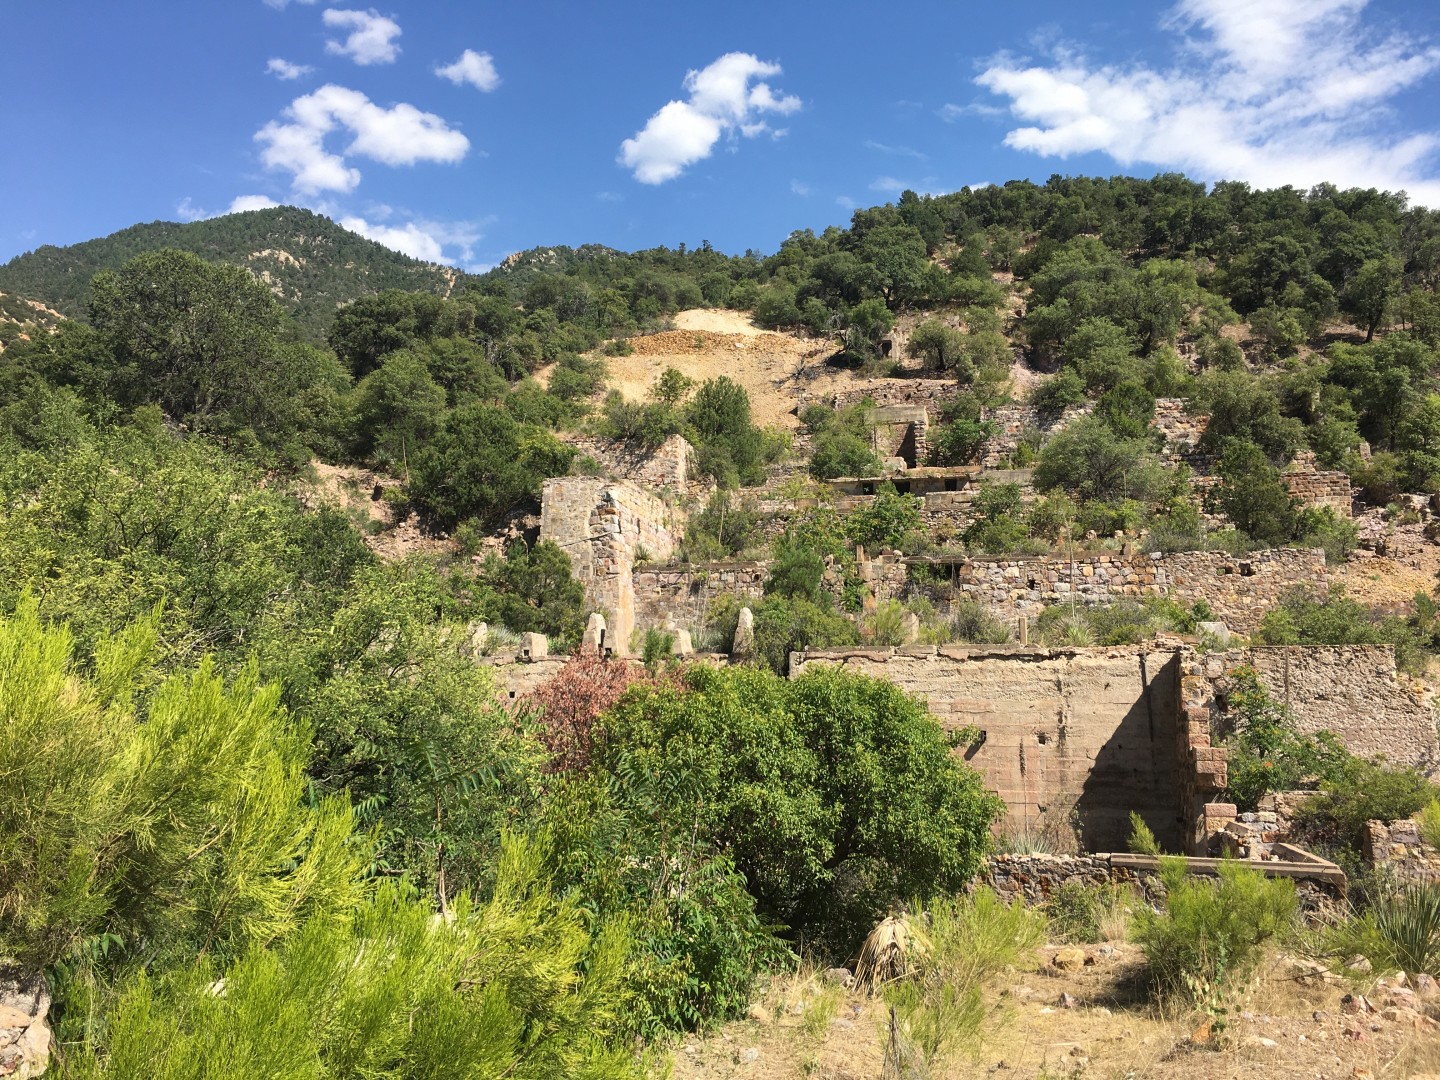
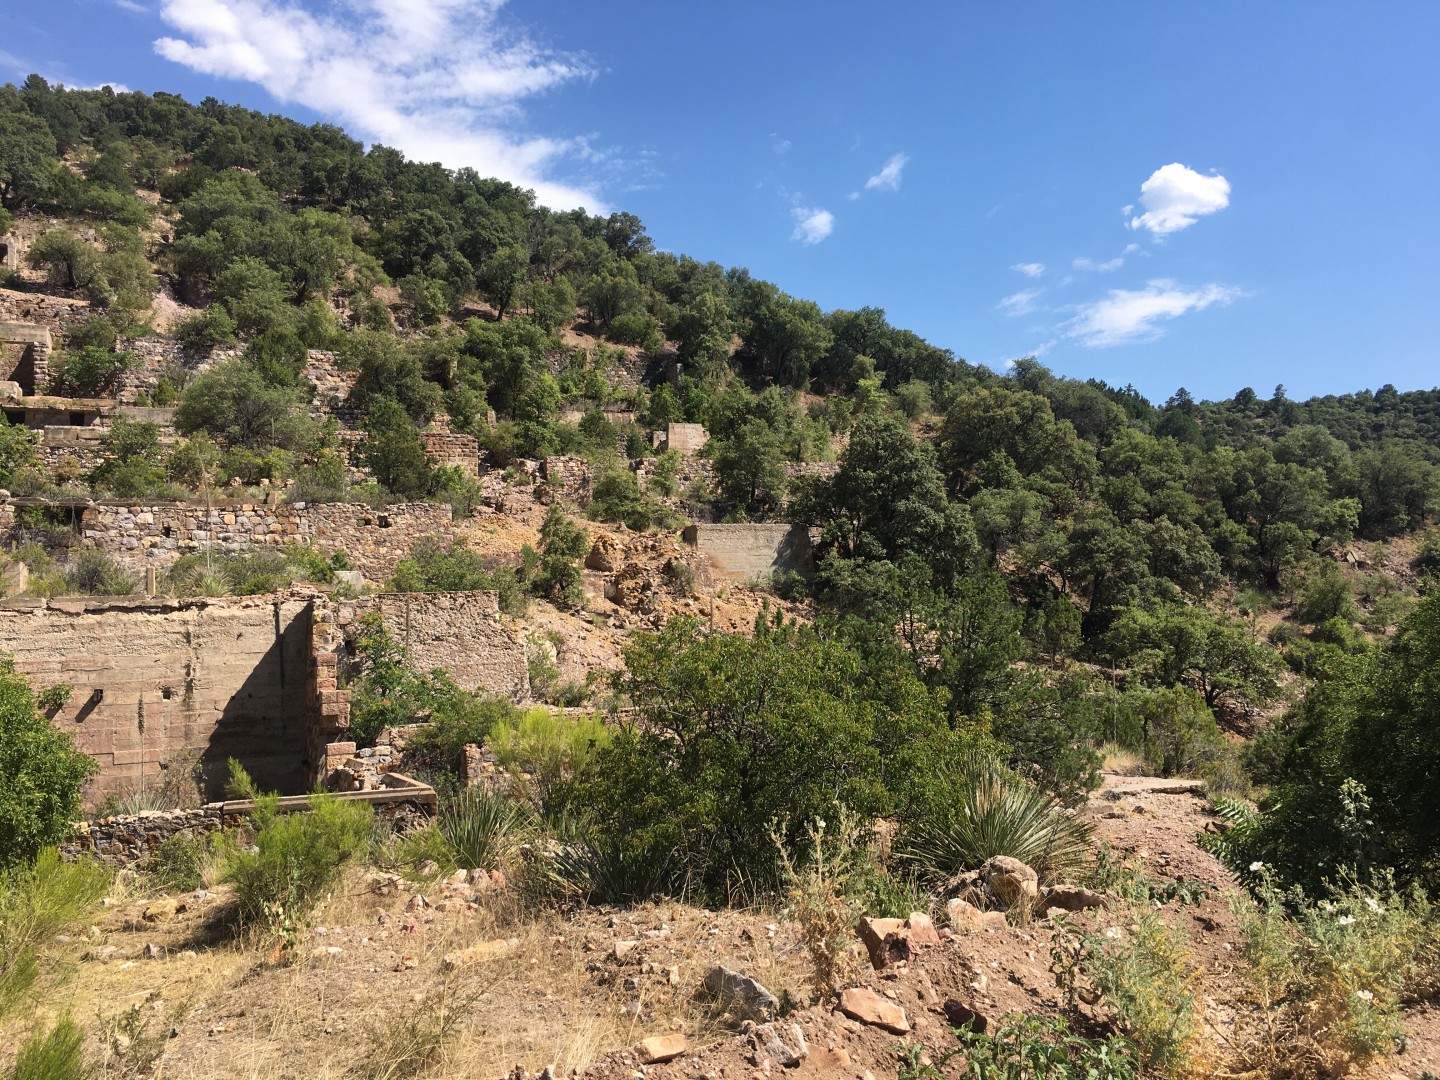
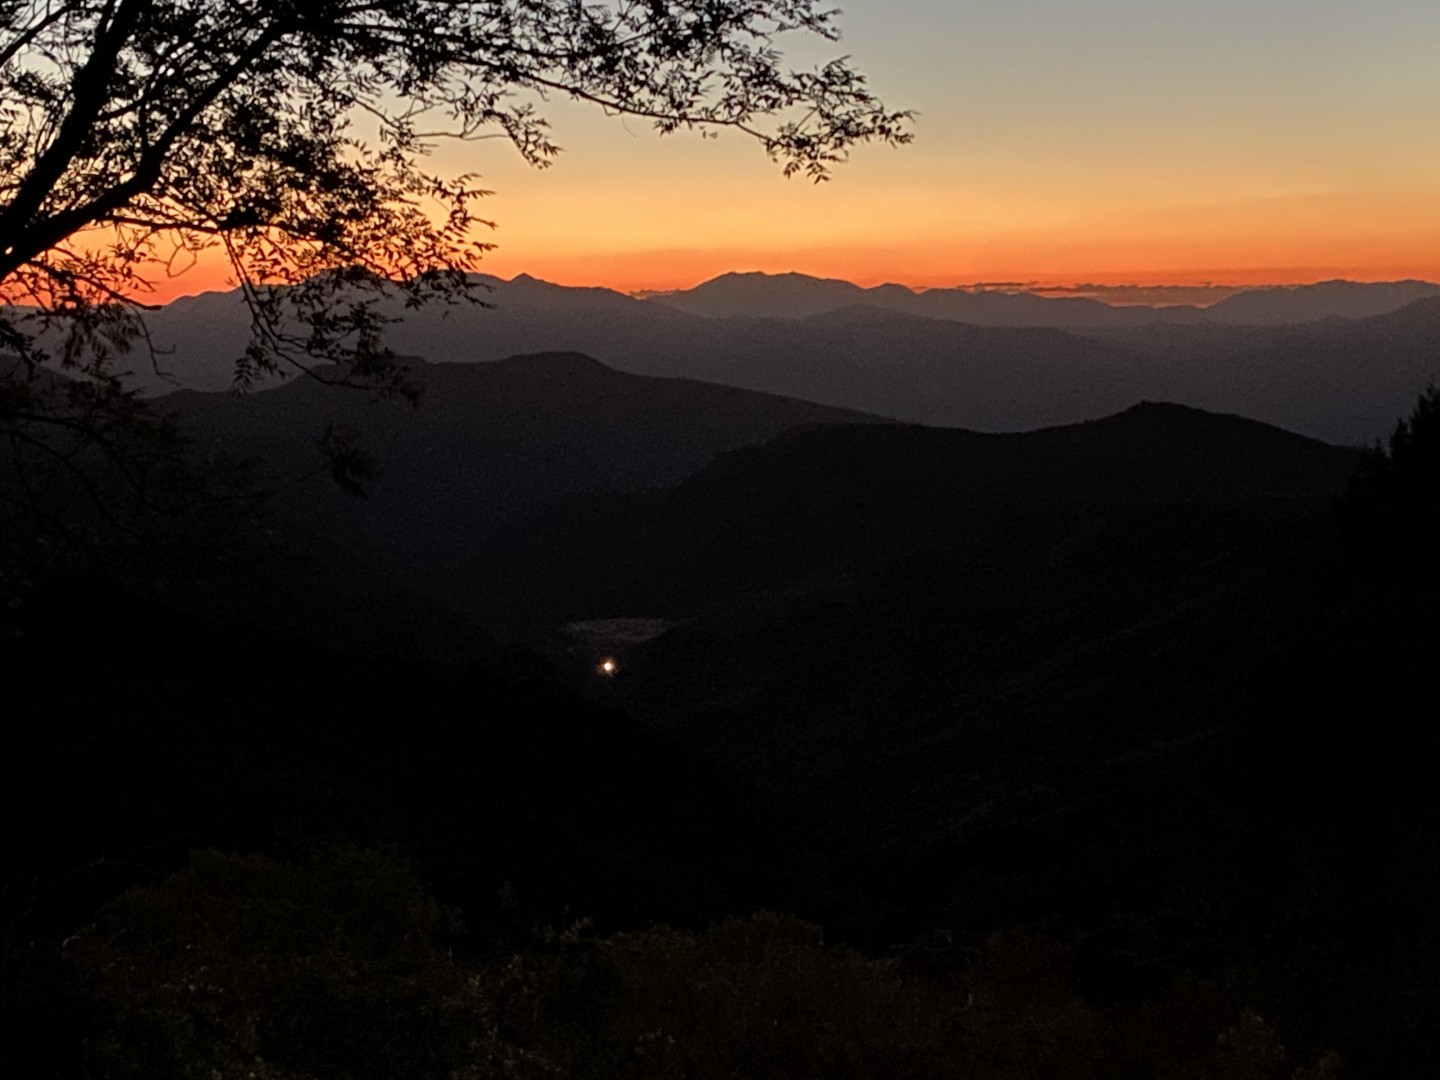
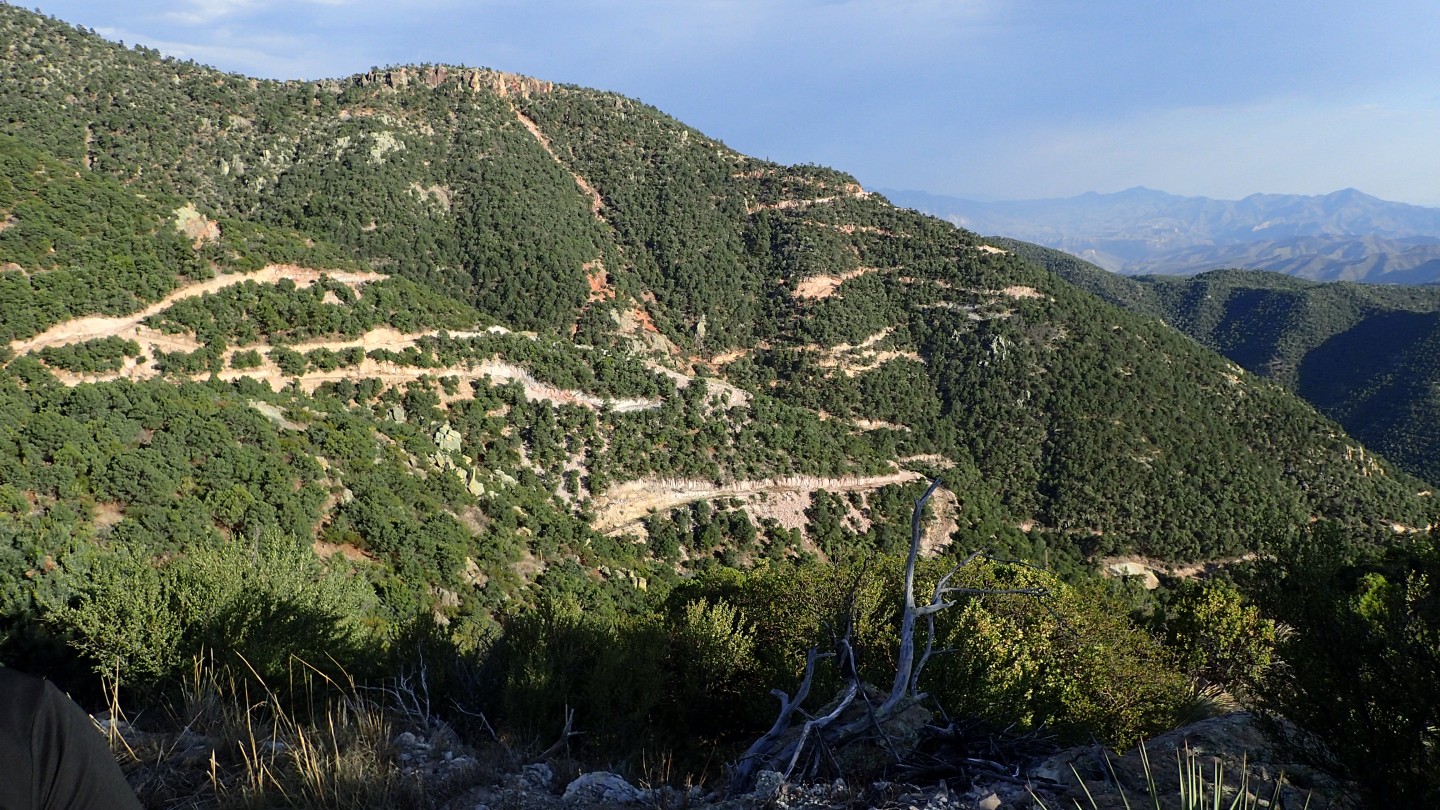
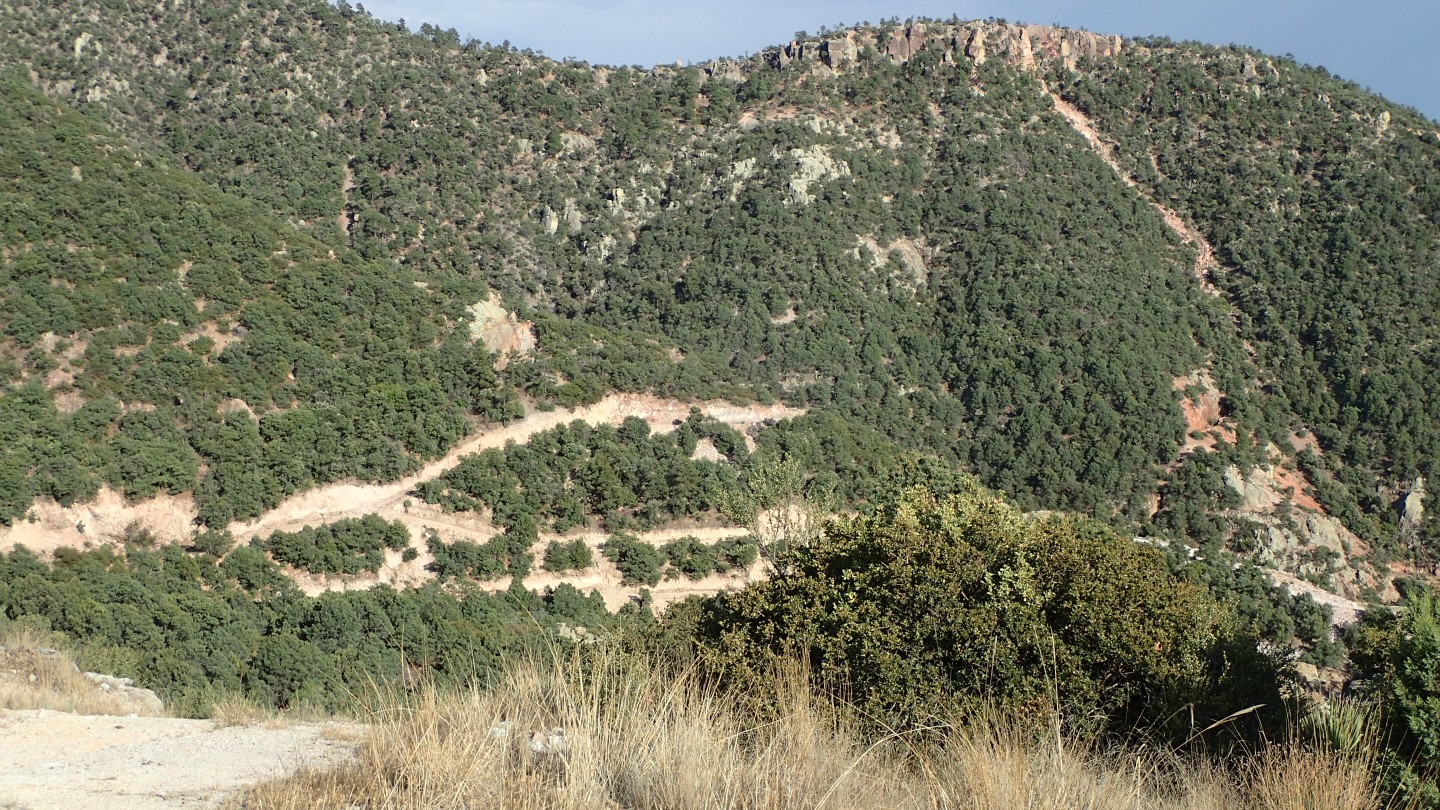
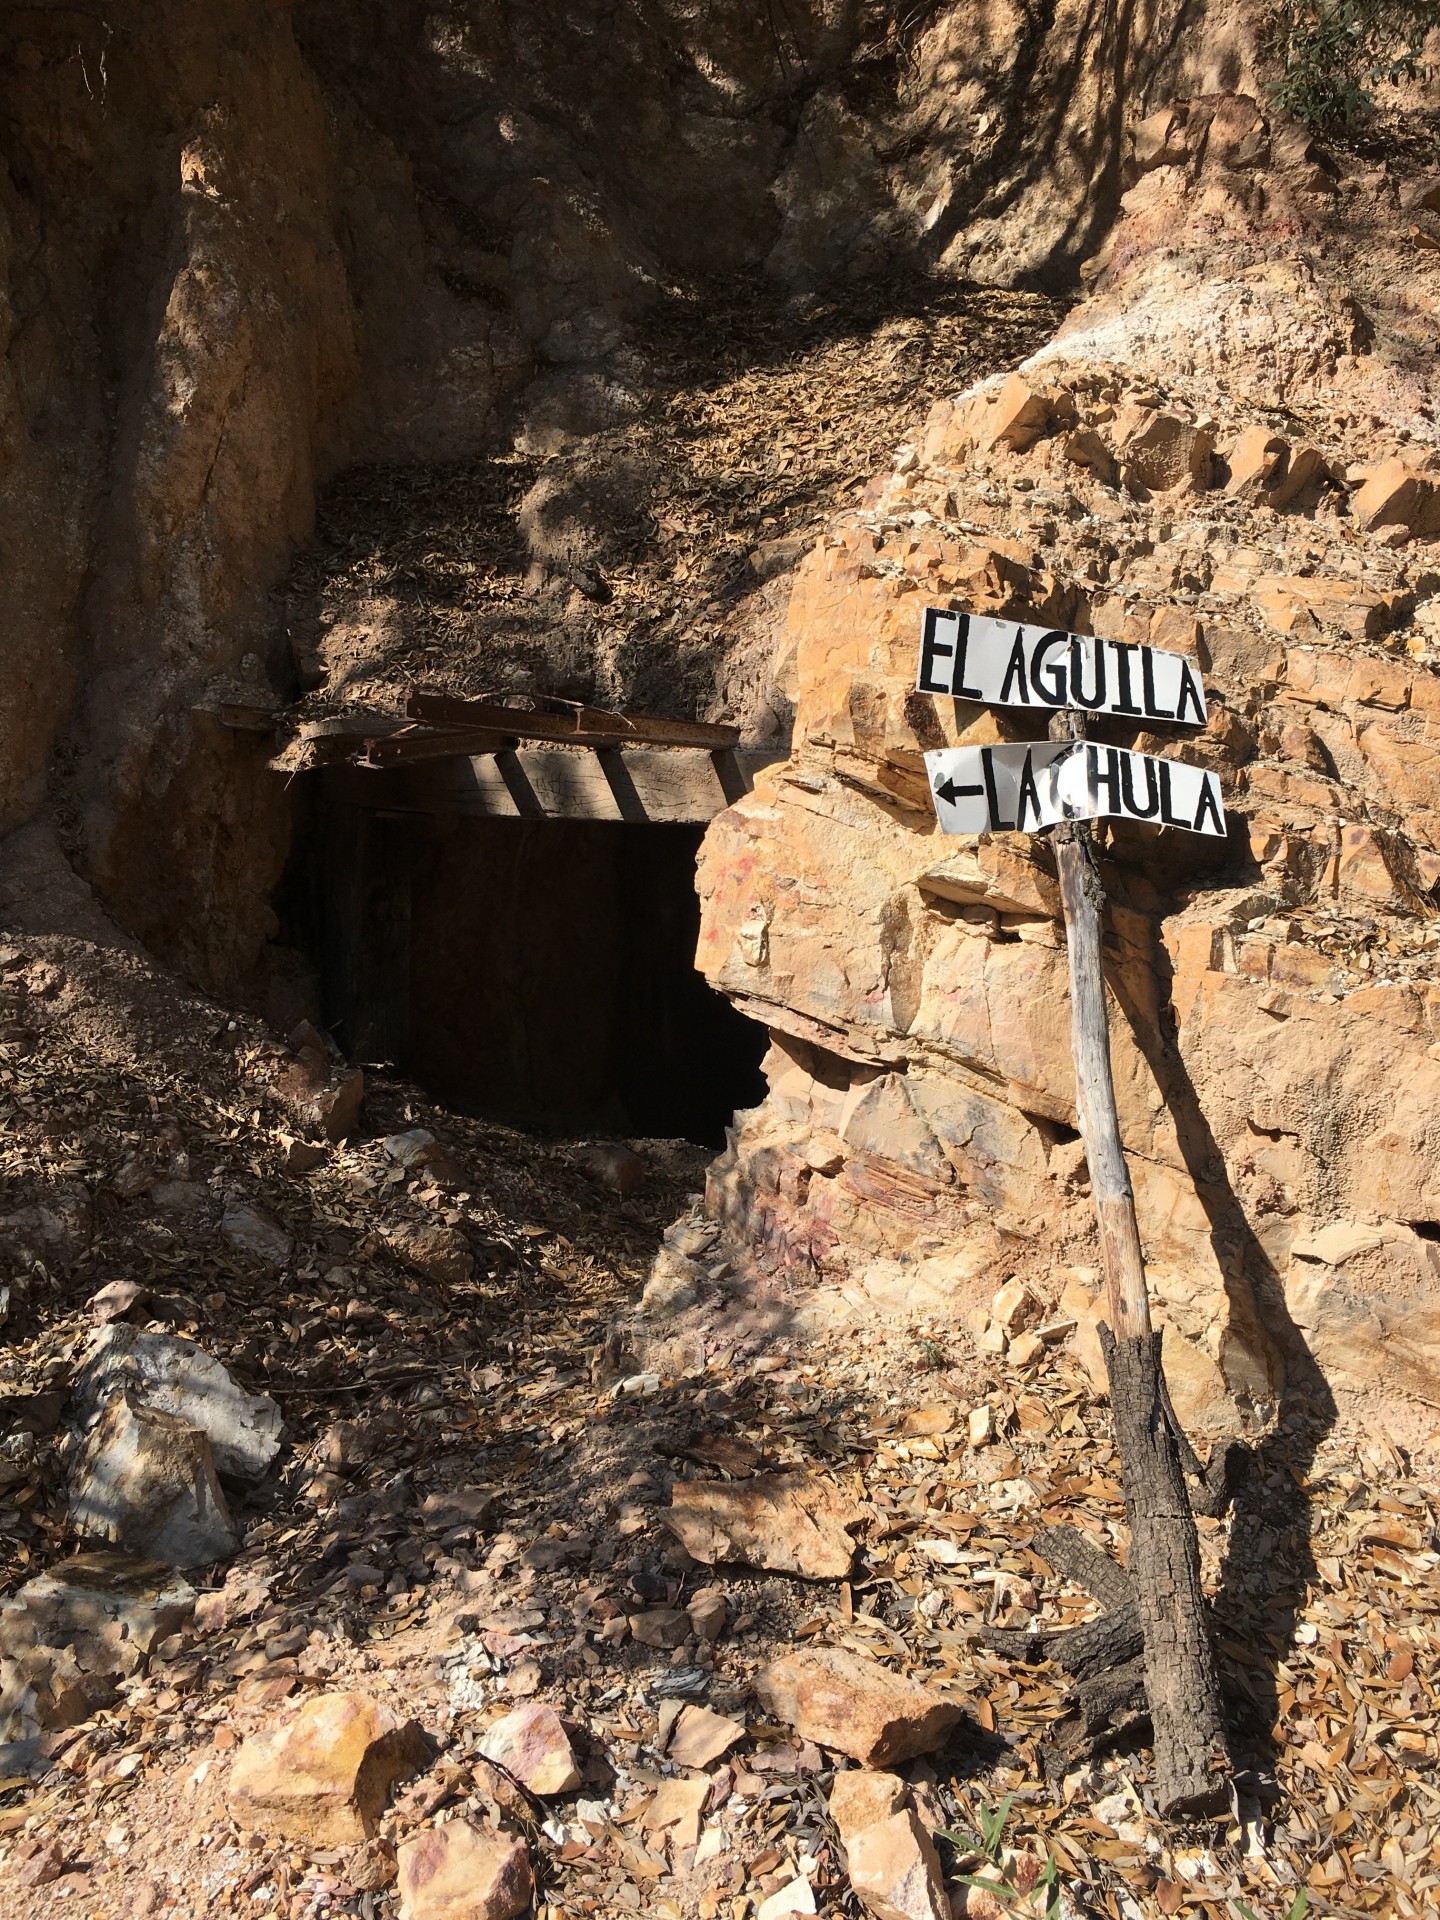
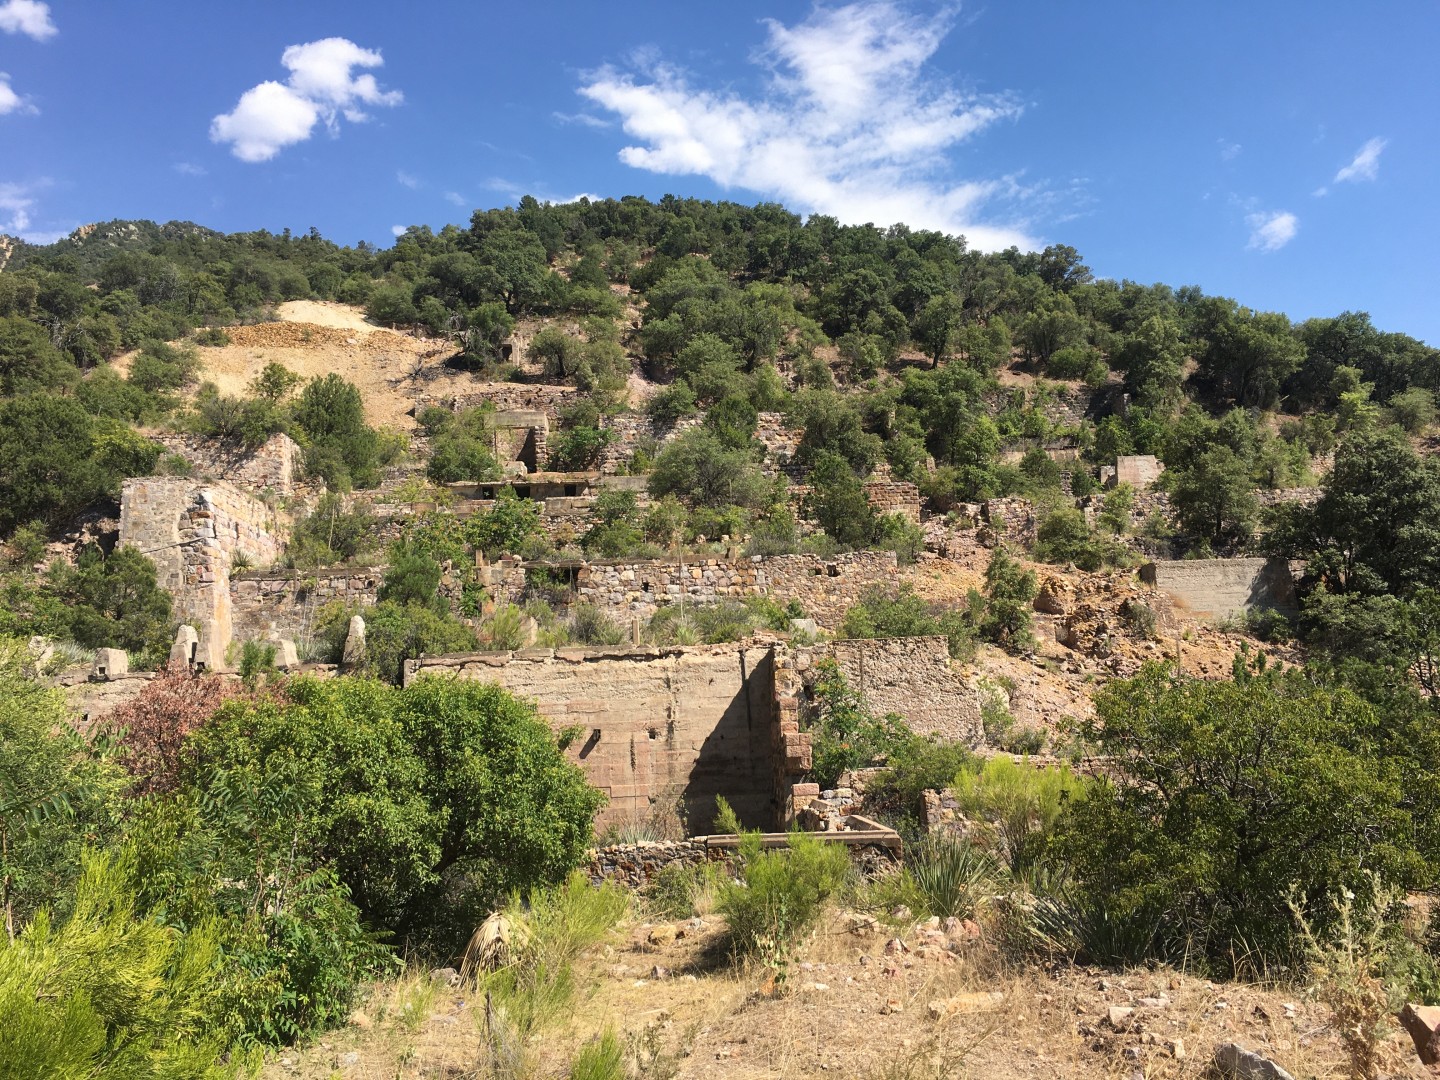
The El Tigre Property lies at the northern end of the Sierra Madre gold belt which hosts many epithermal gold and silver deposits including Dolores, Santa Elena and Chispas at the northern end. In 1896, gold was first discovered on the property in the Gold Hill area and mining started with the Brown Shaft in 1903. The focus soon changed to mining high-grade silver veins in the area with much of the production coming from the El Tigre vein. Underground mining on the El Tigre vein extended 1,450 meters along strike and mined on 14 levels to a depth of 450 meters. By the time the mine closed in 1938, it is reported to have produced a total of 353,000 ounces of gold and 67.4 million ounces of silver from 1.87 million tons (Craig, 2012). The average grade mined during this period was over 2 kilograms silver equivalent per ton.
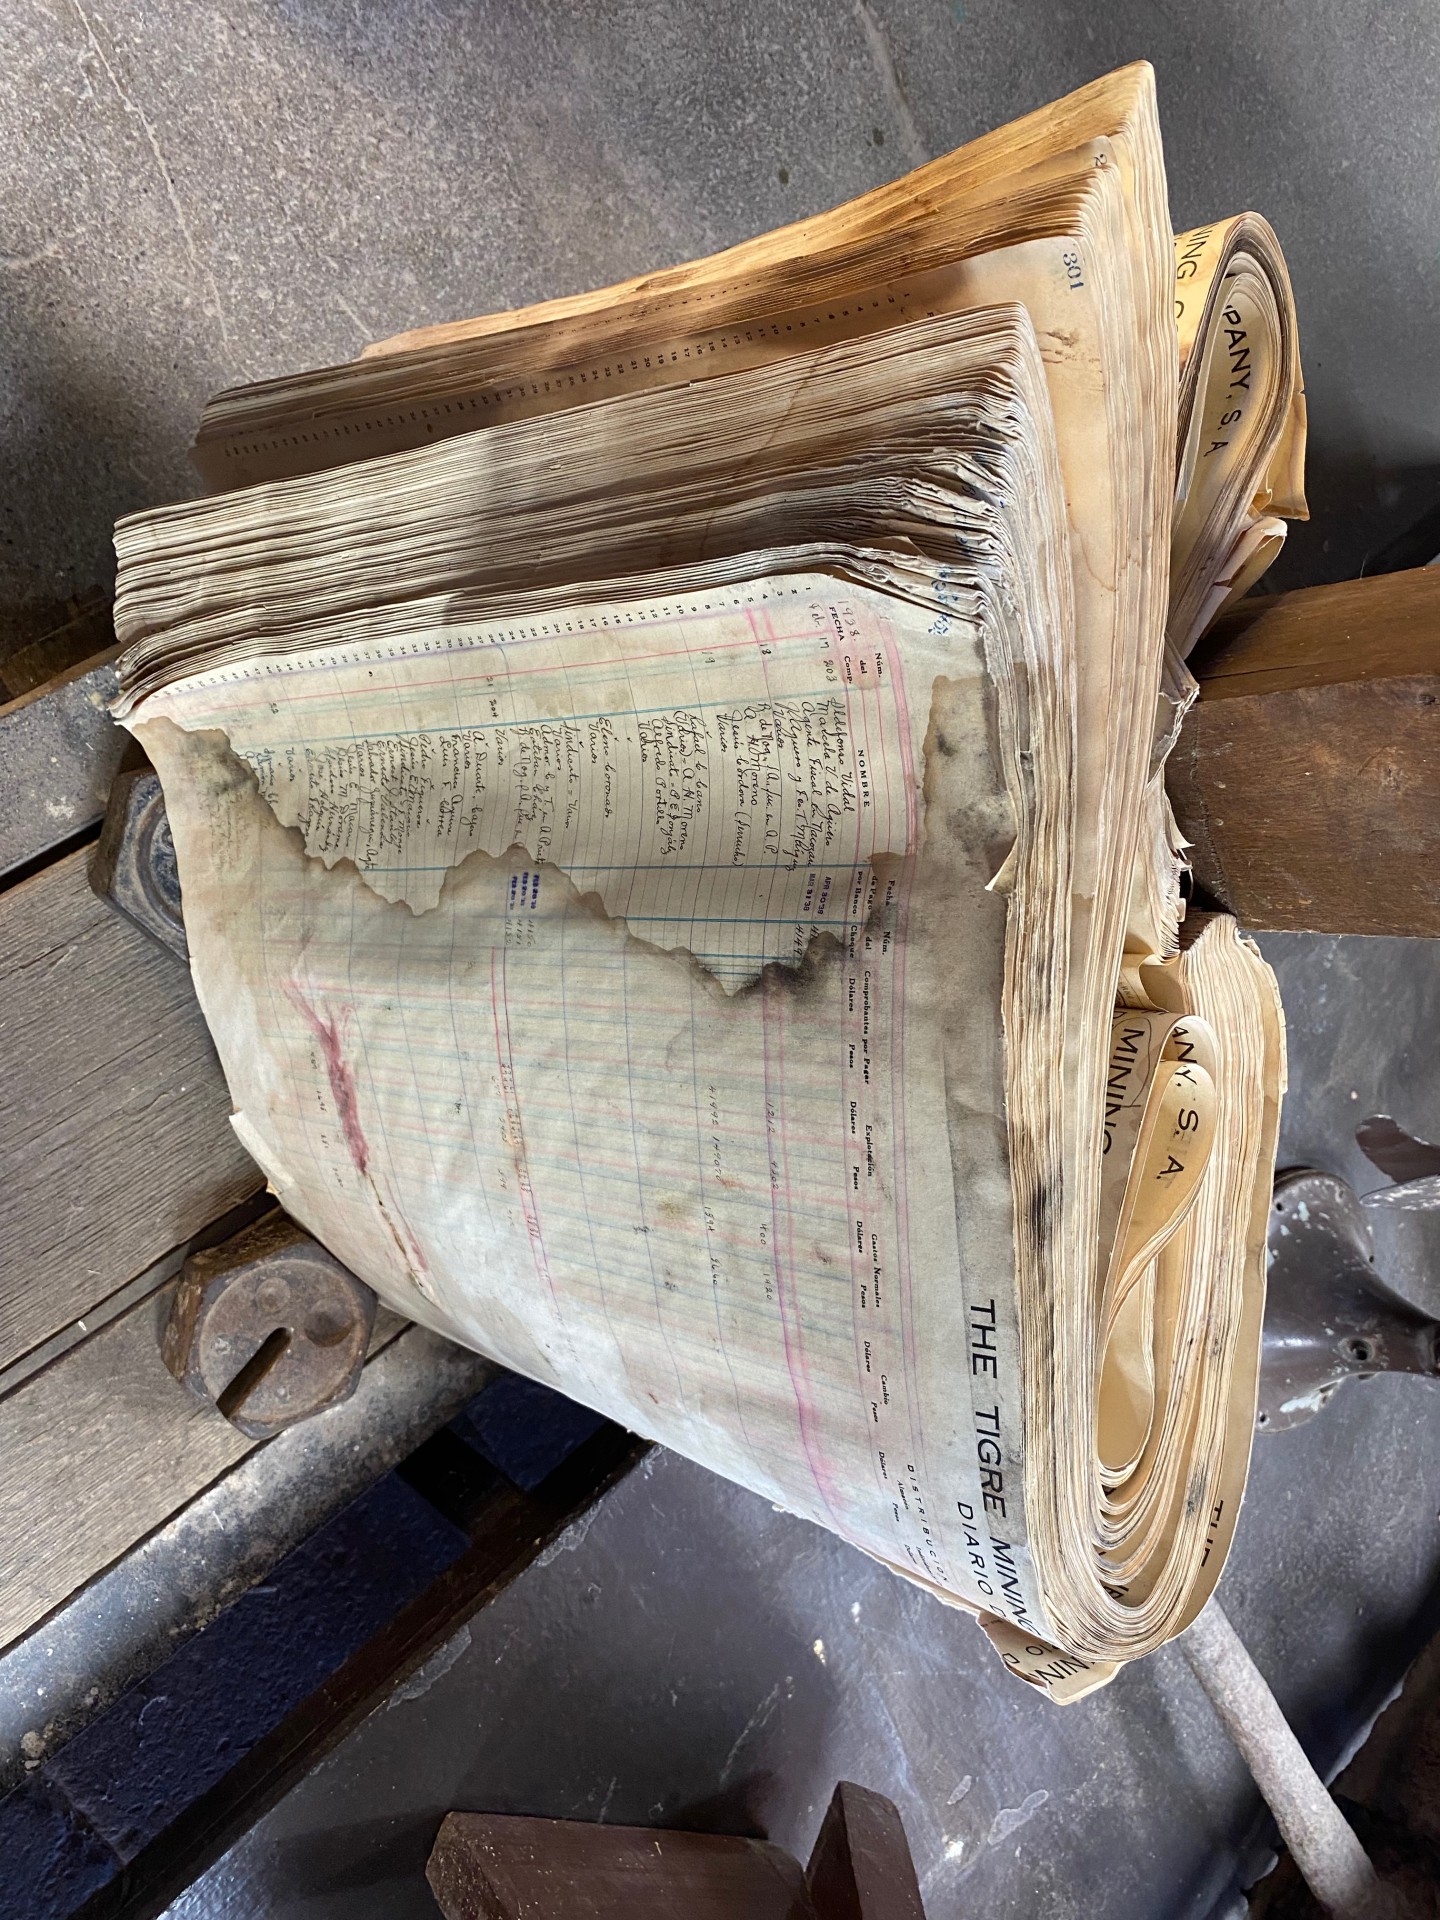
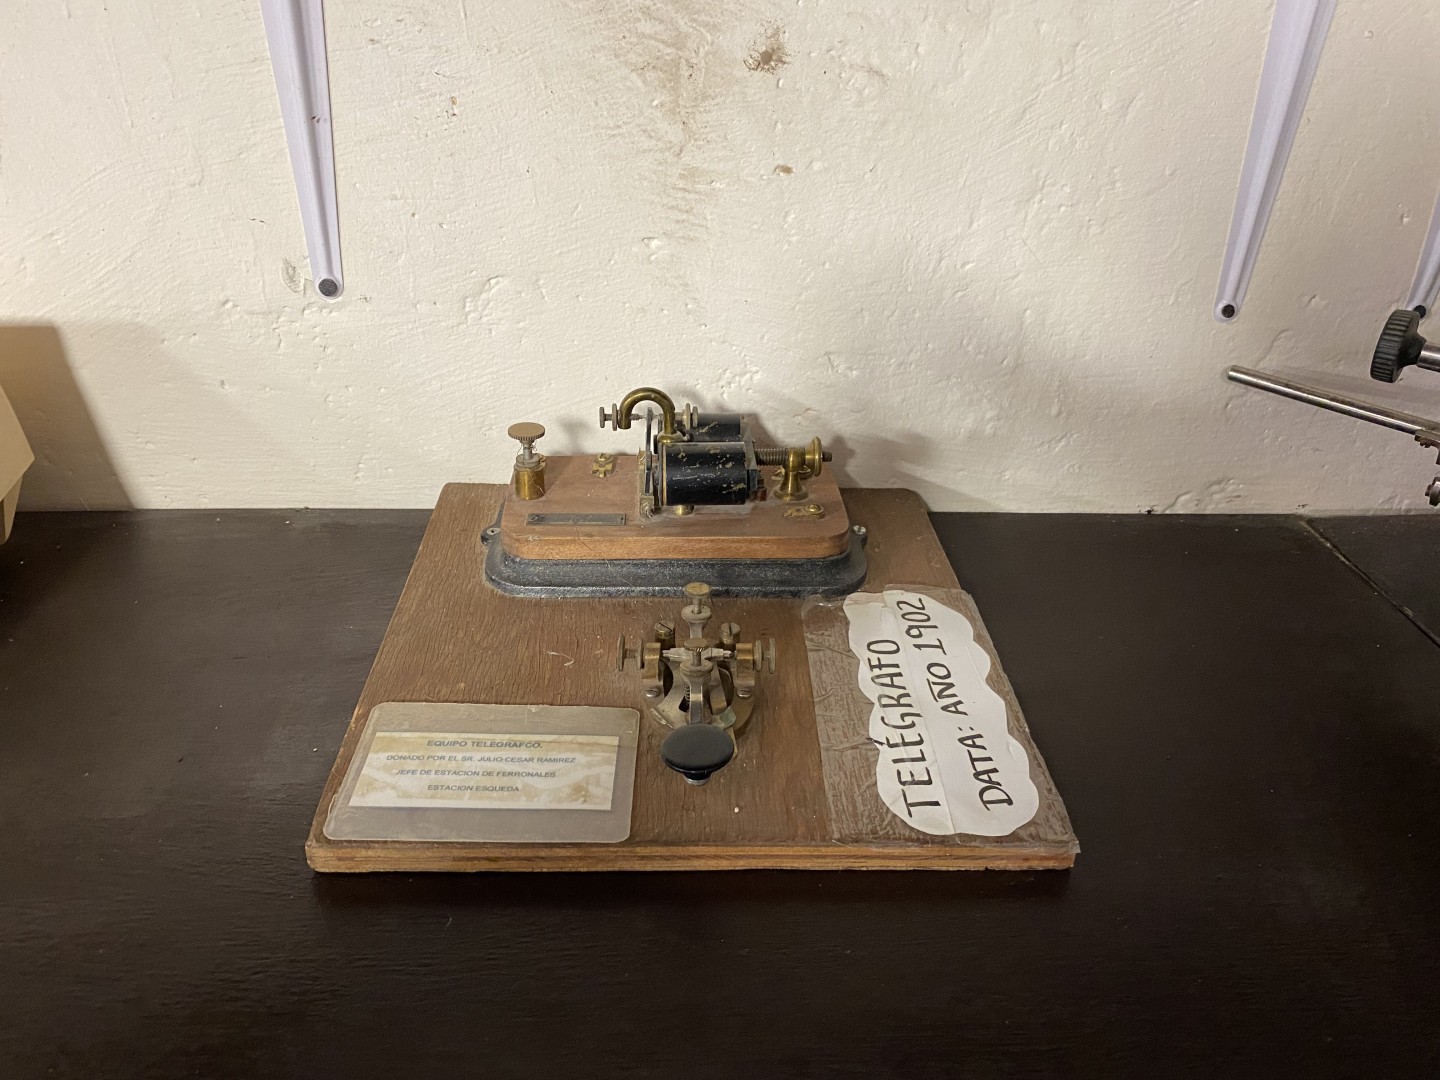
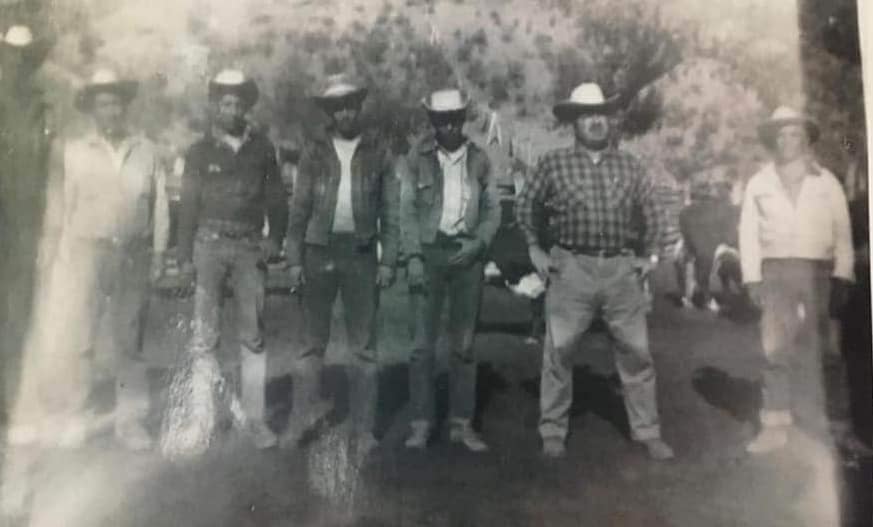
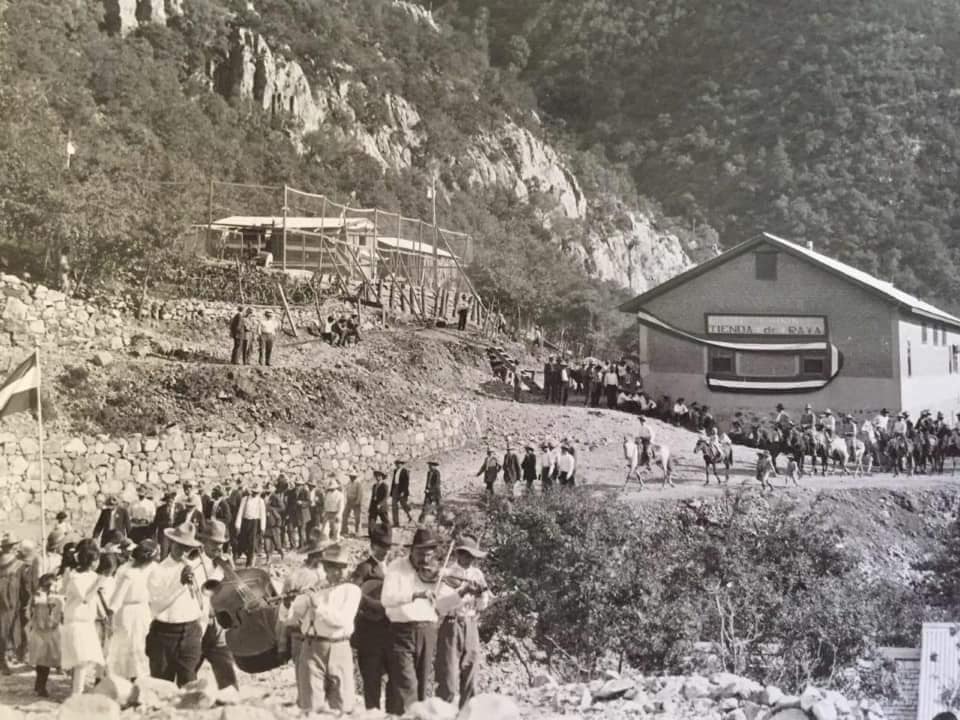
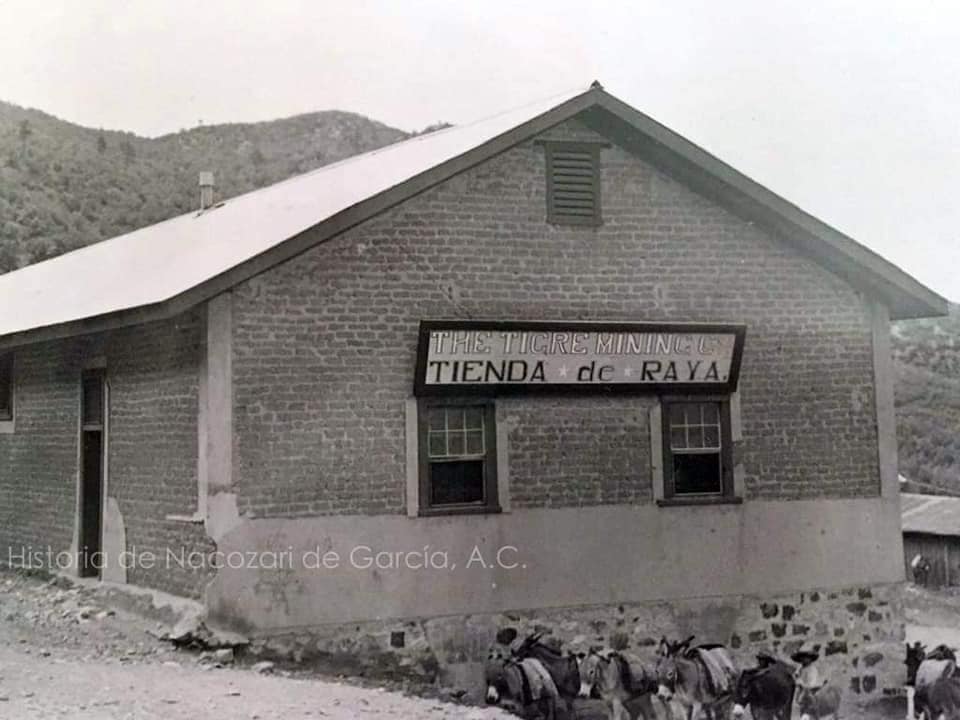
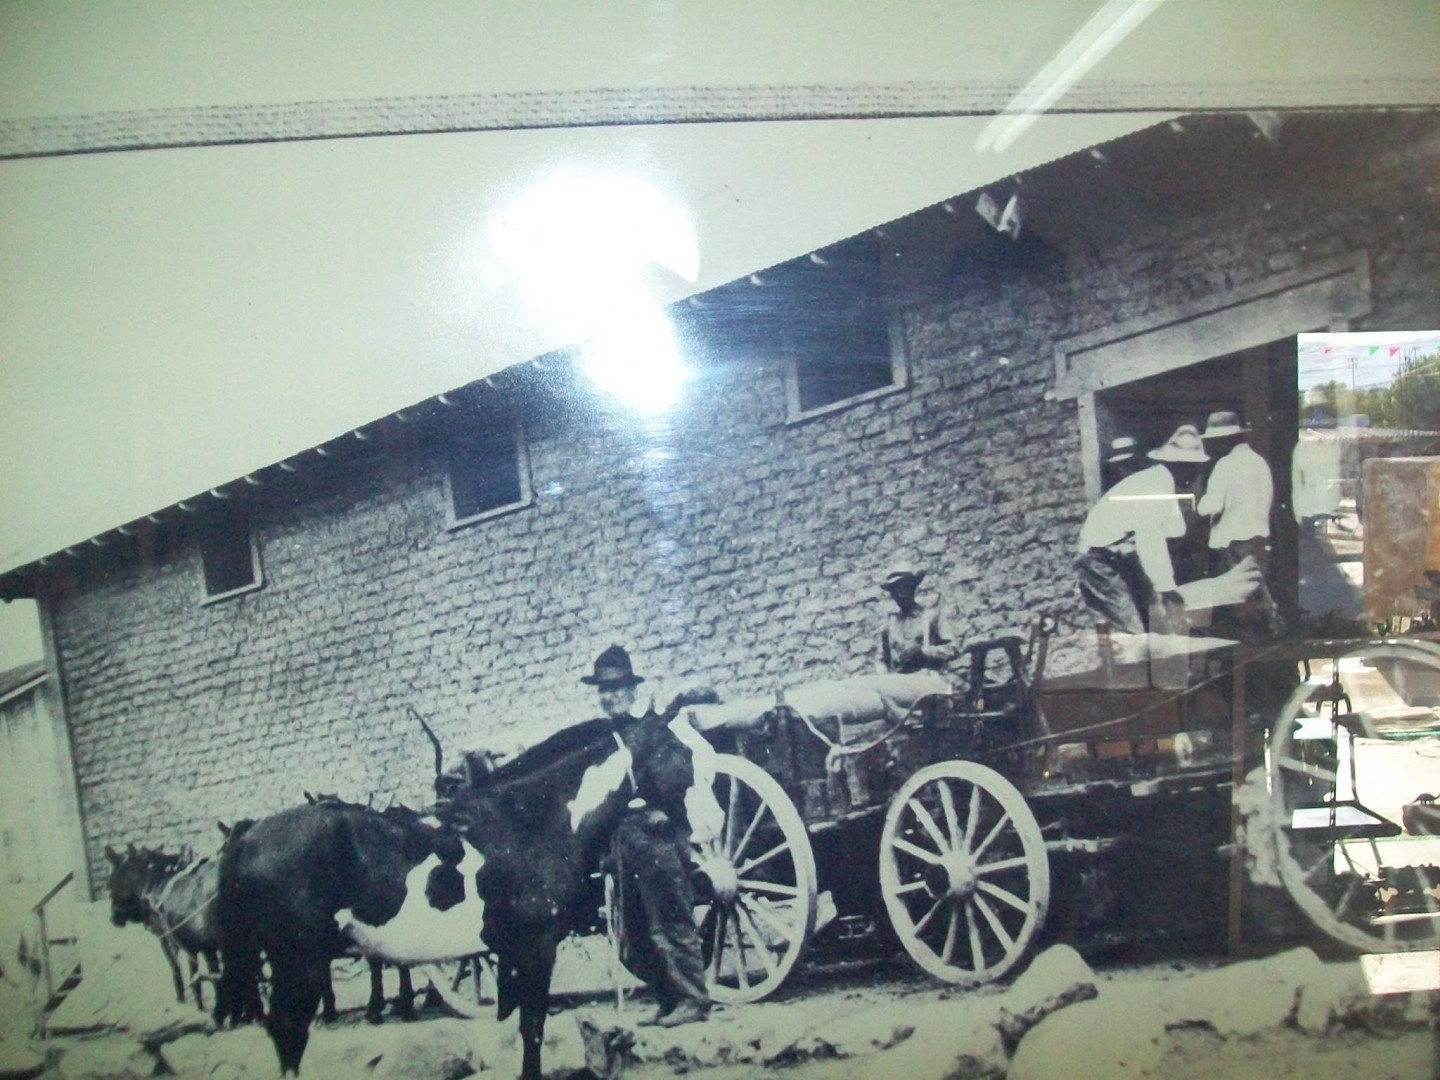
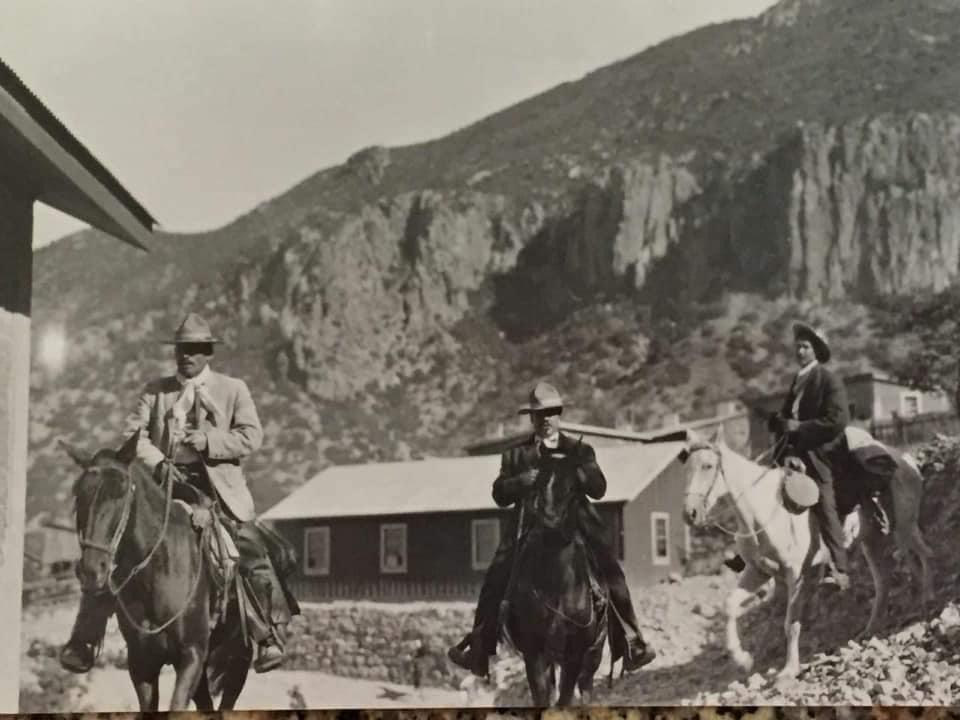
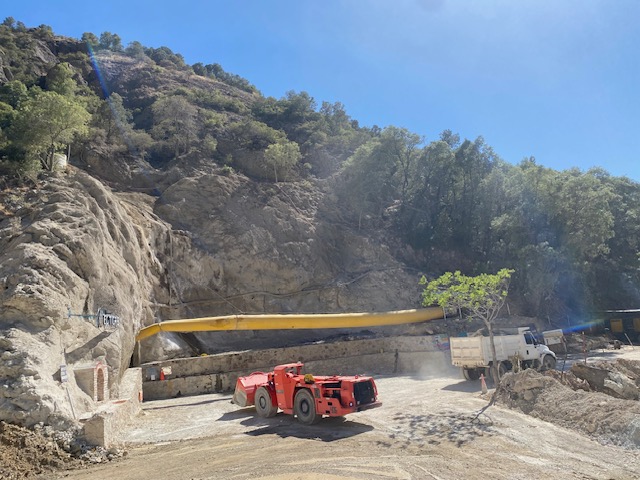
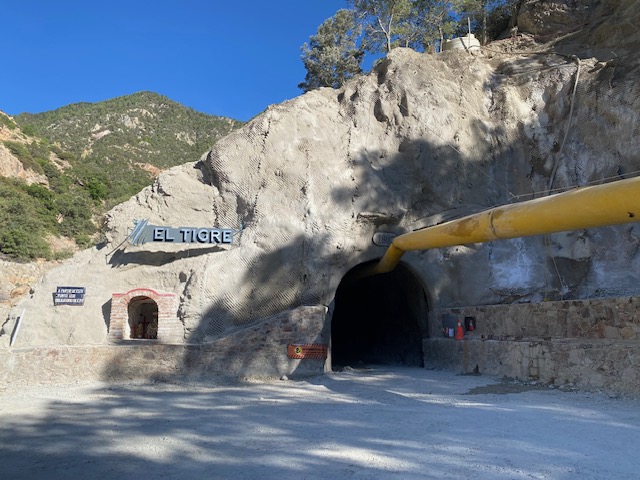
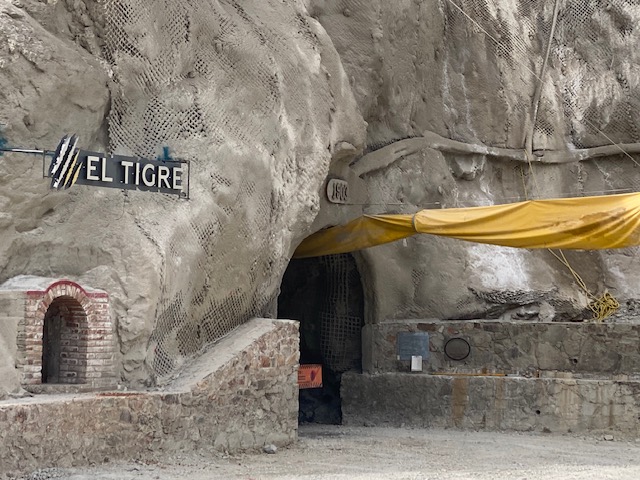
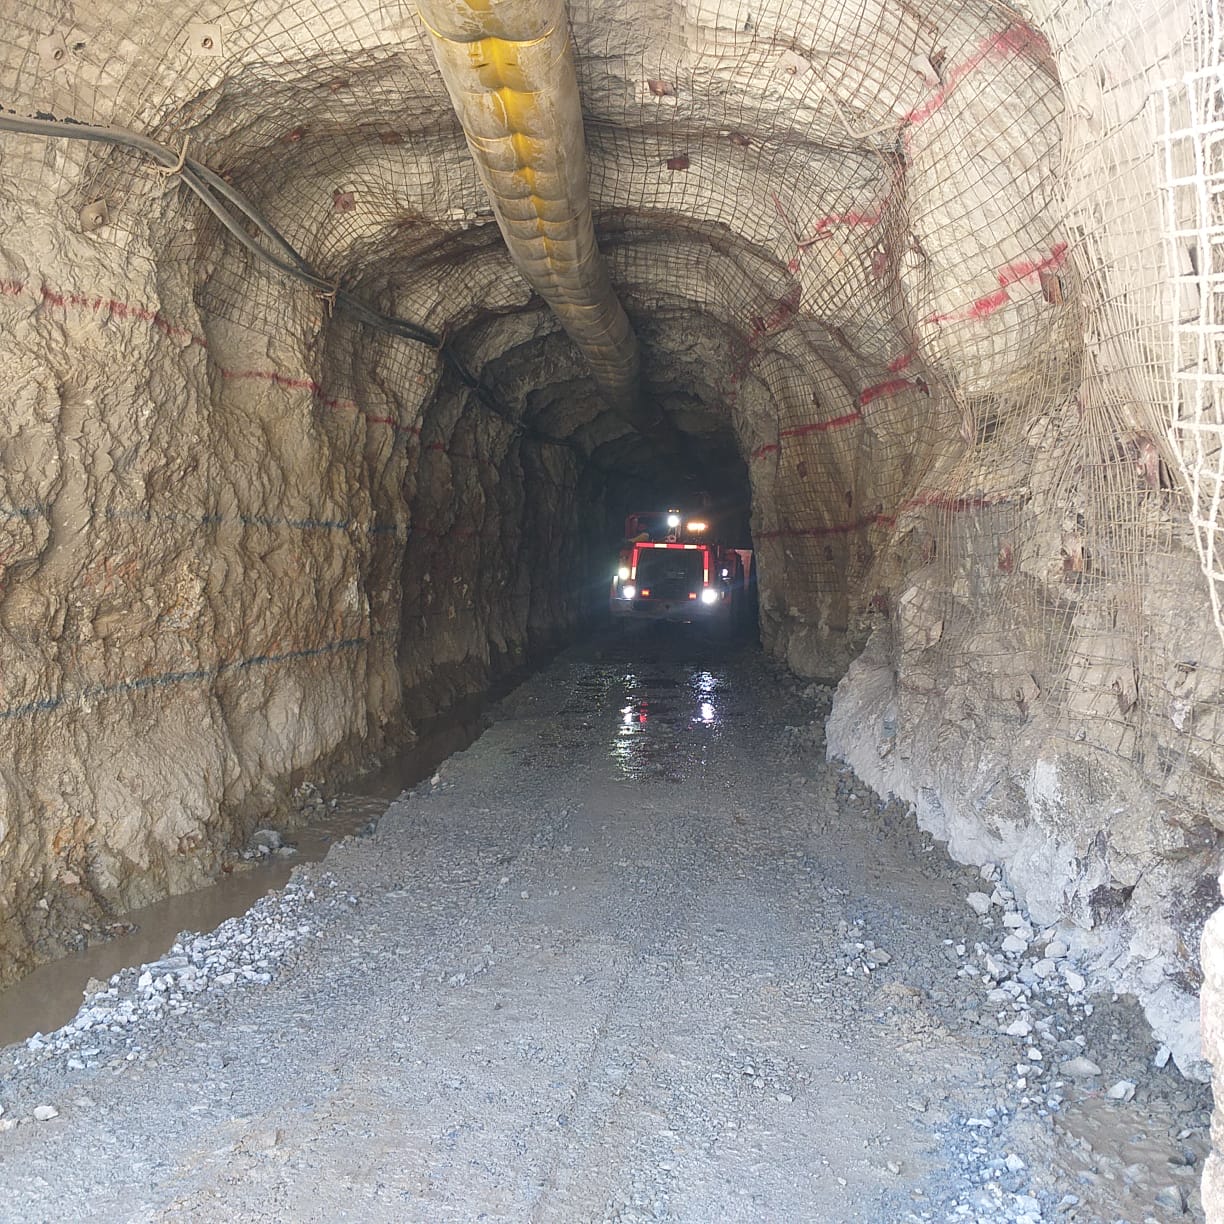
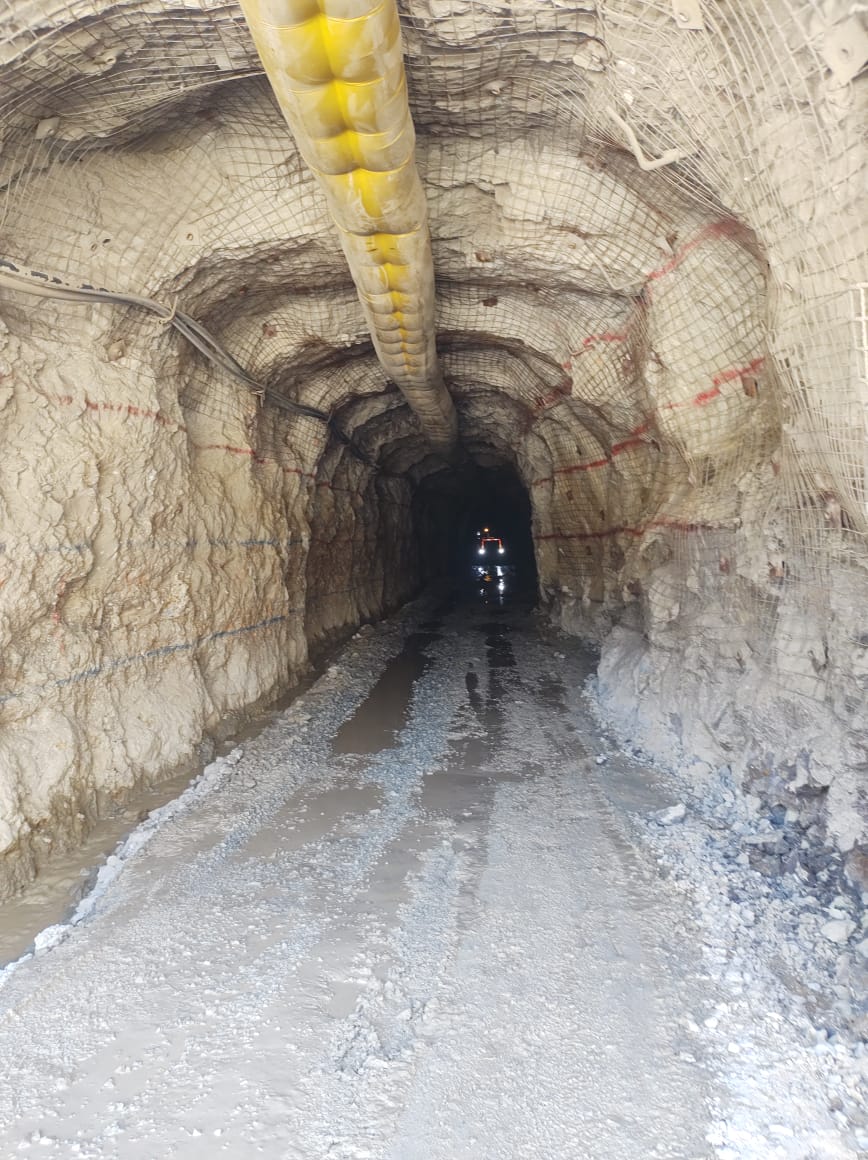
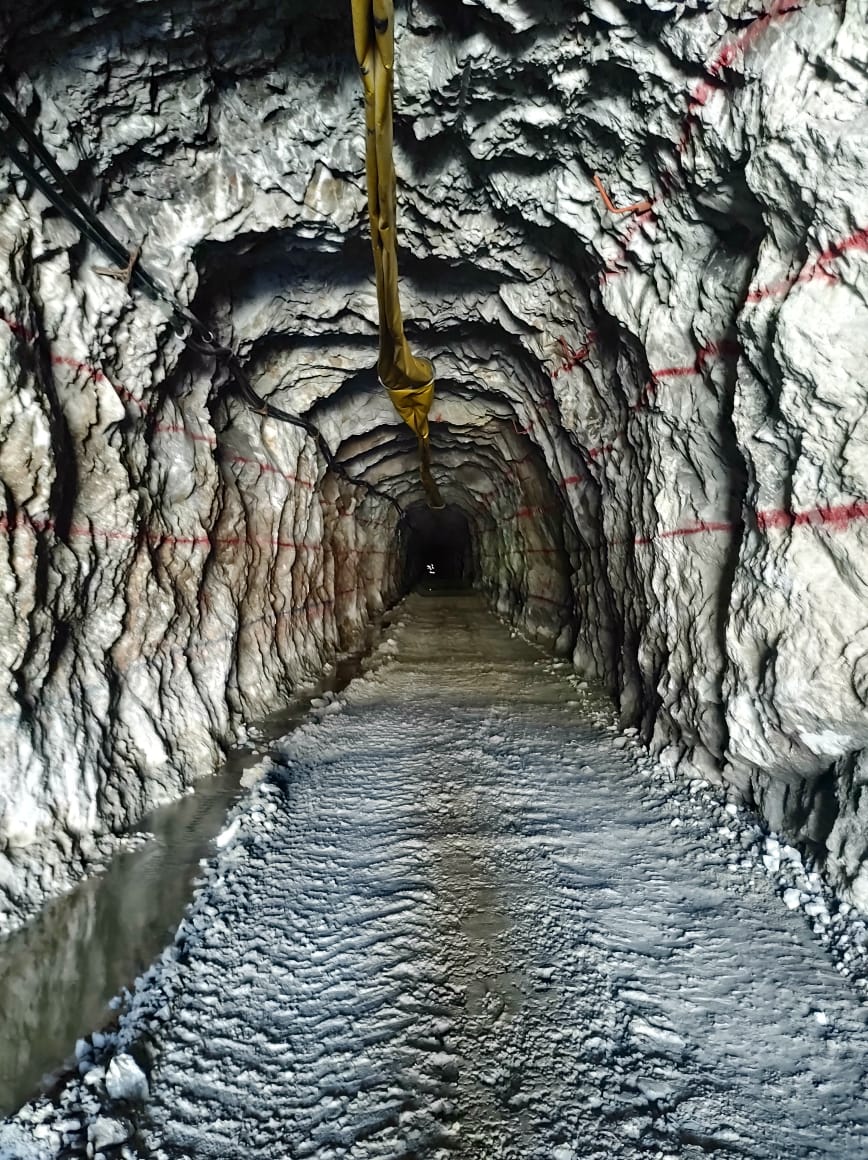
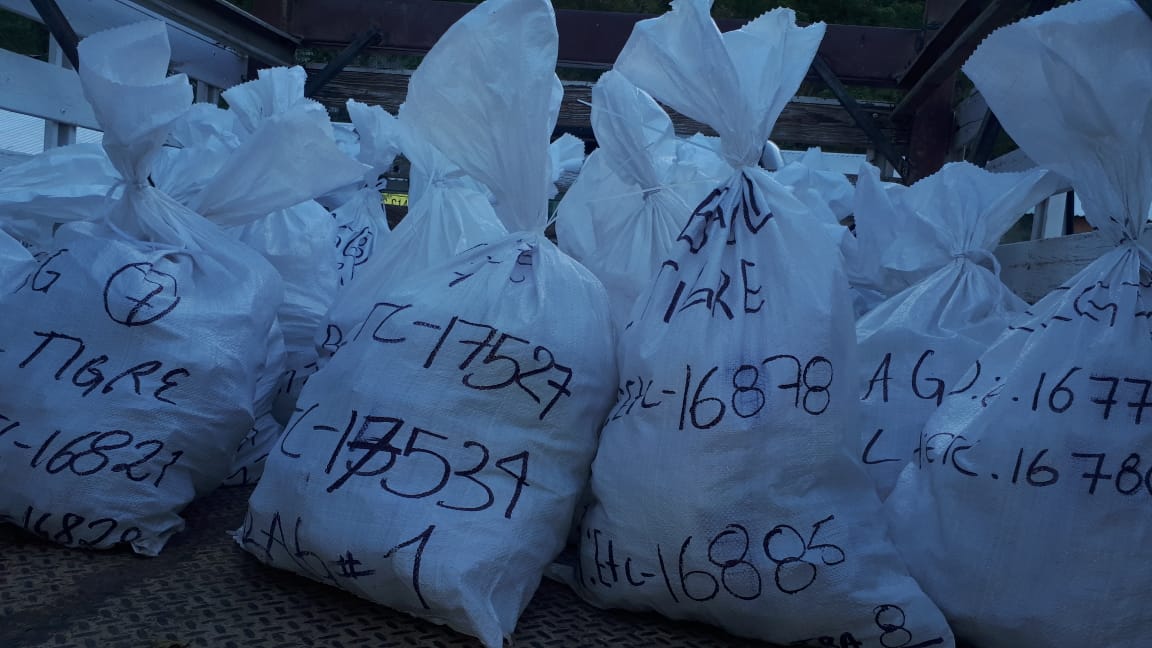
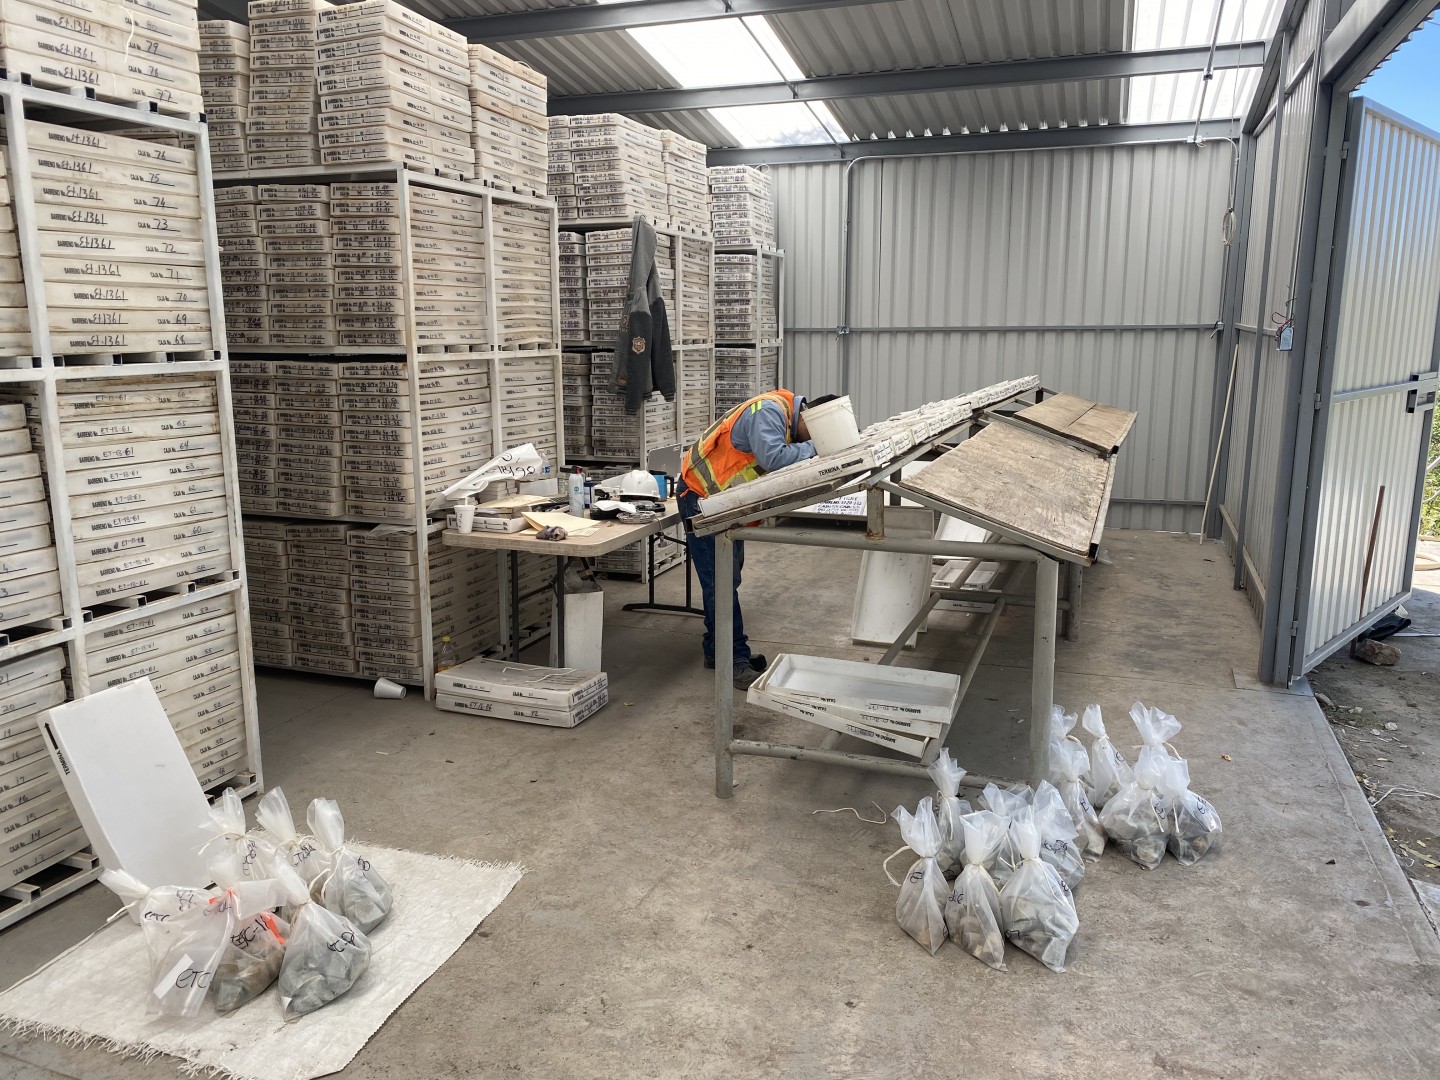
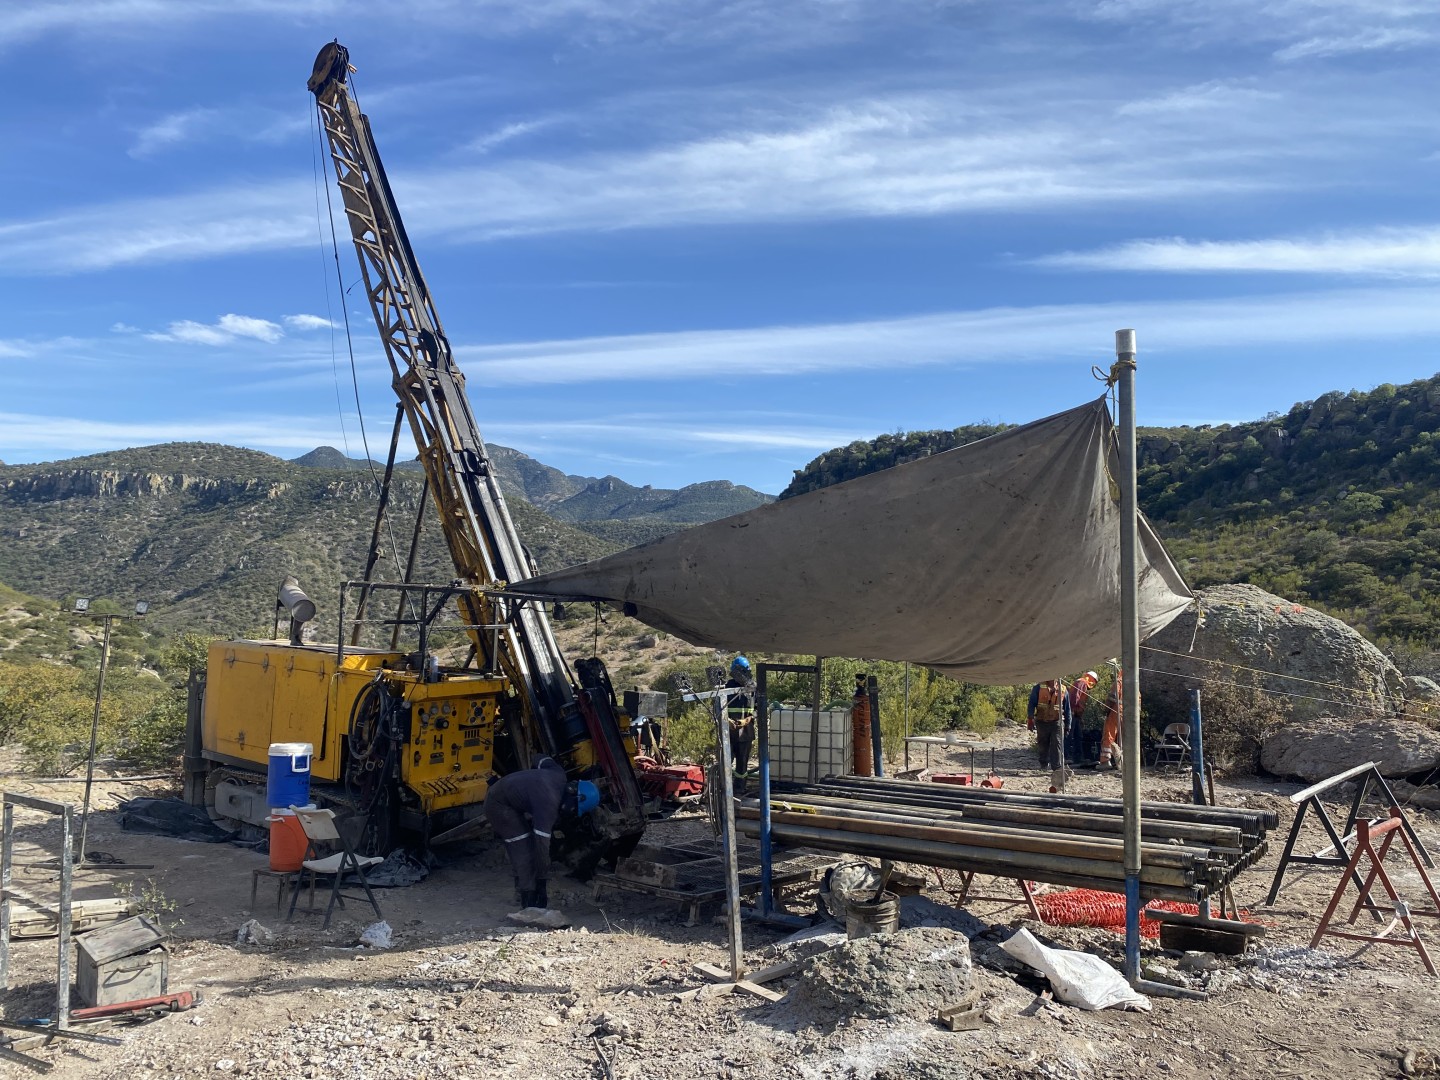
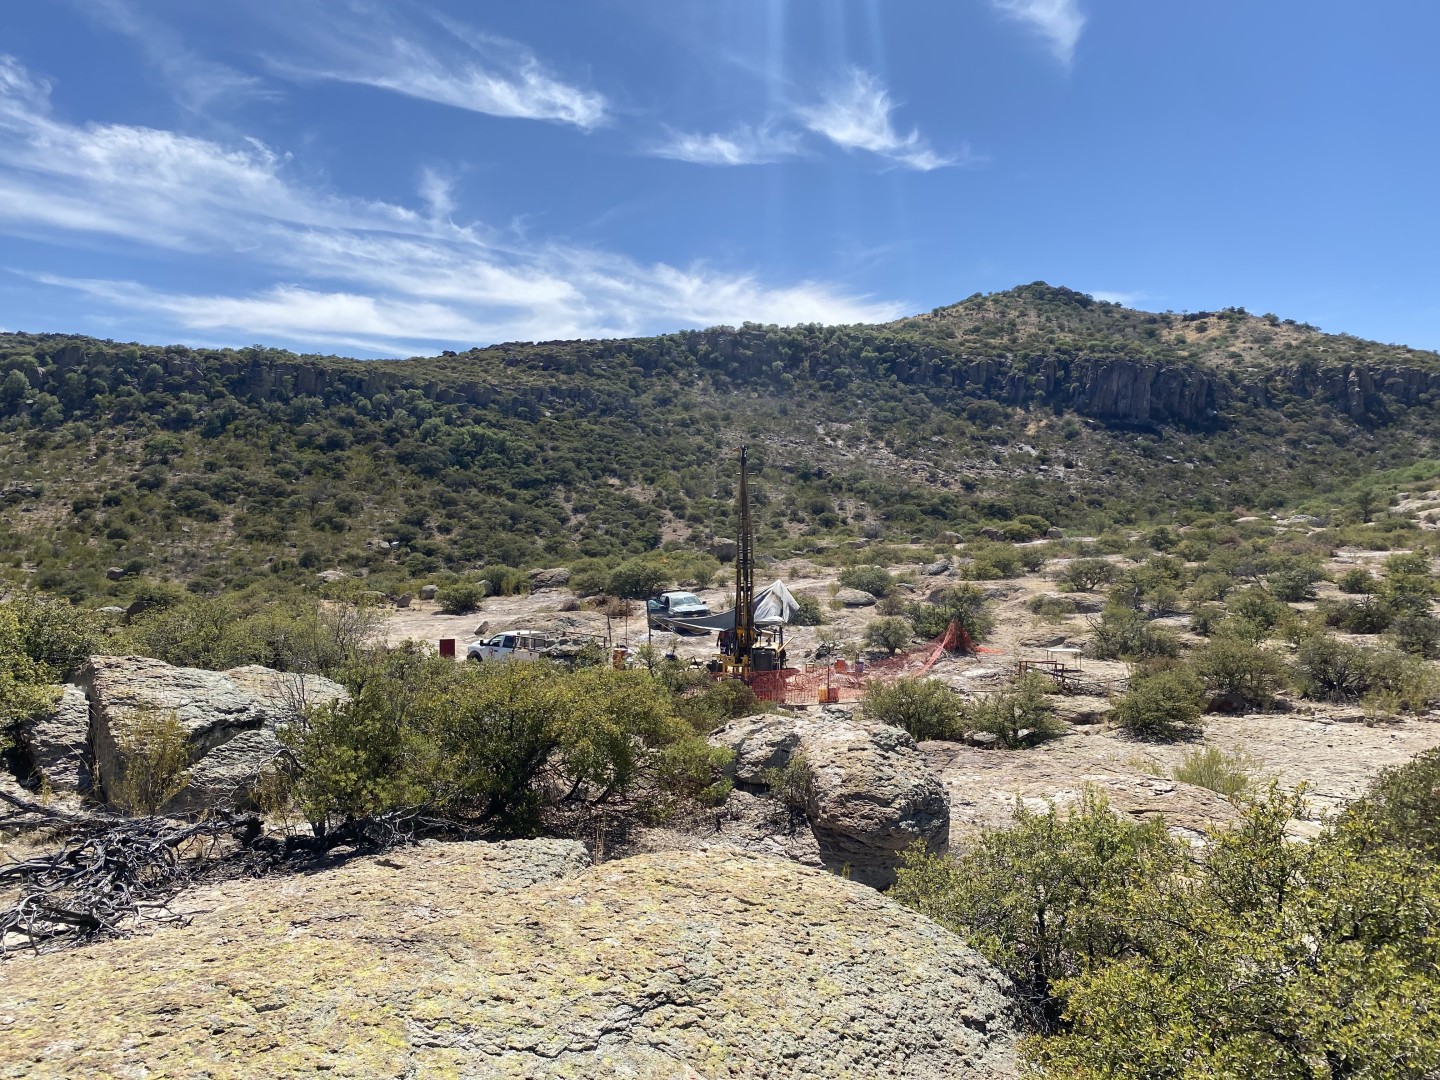
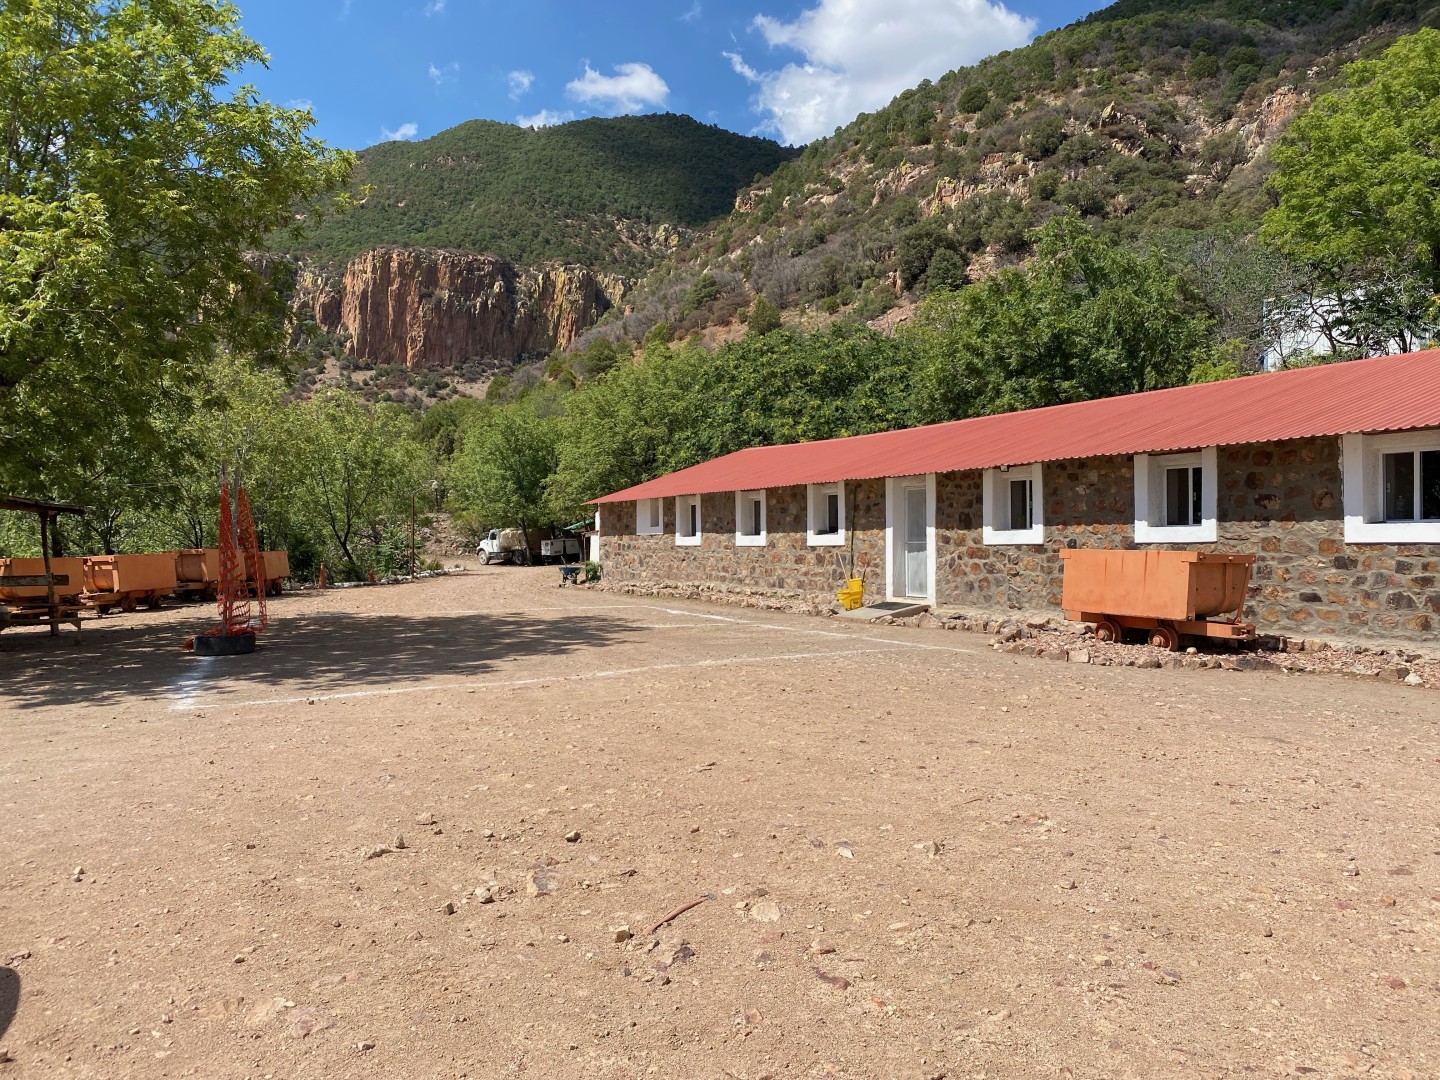
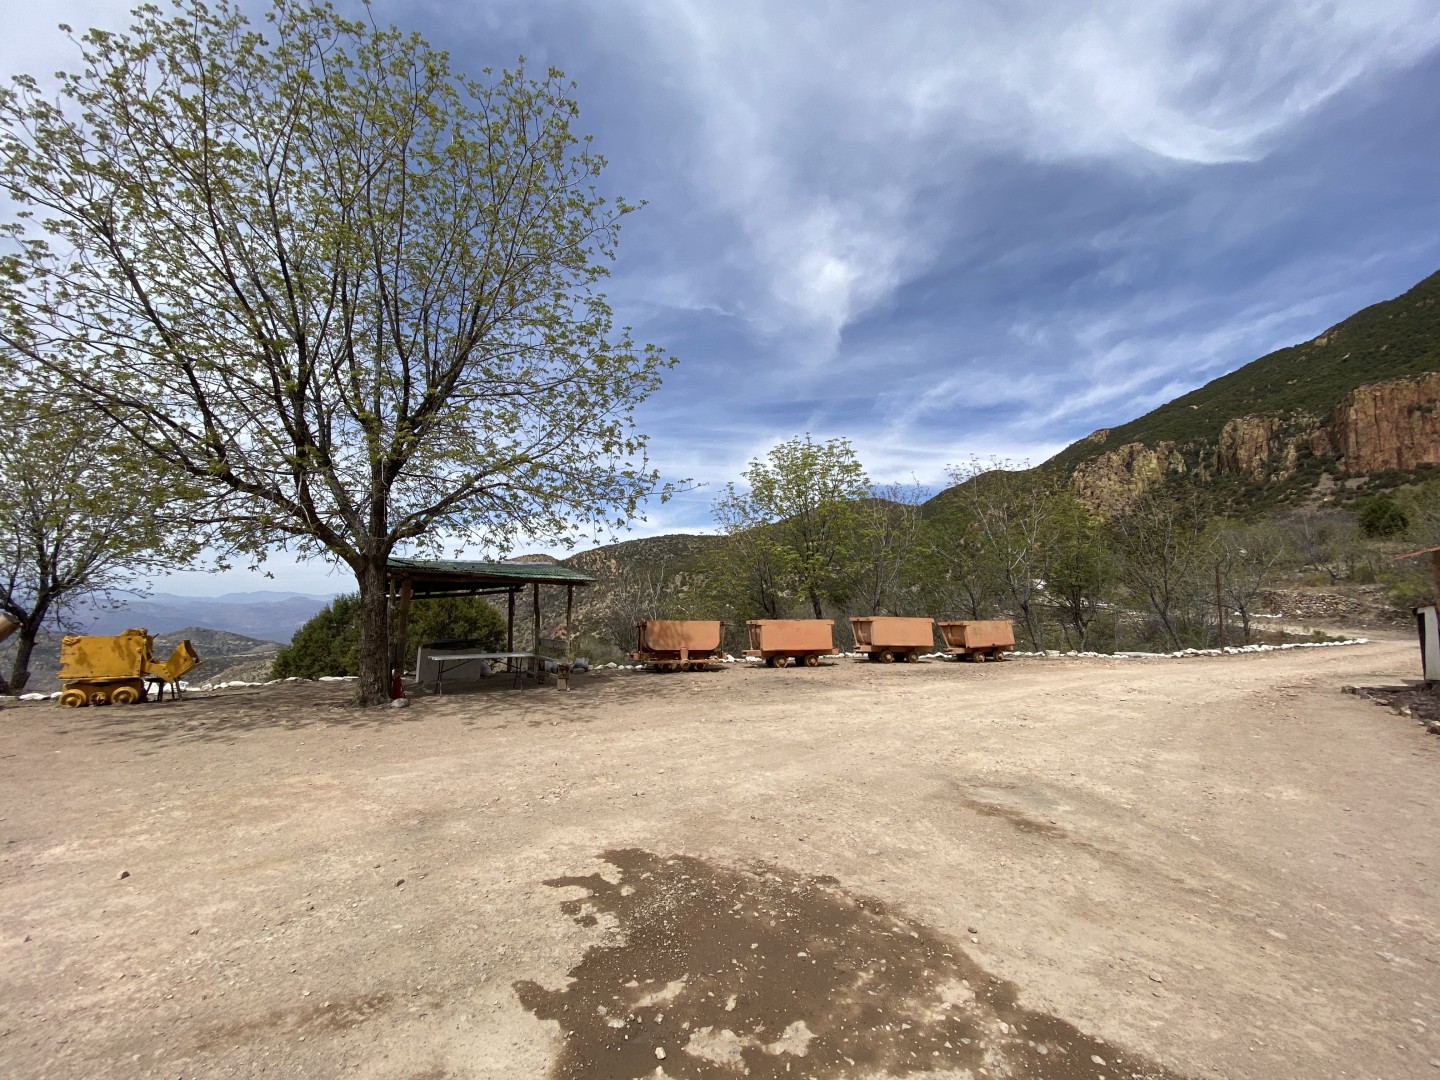
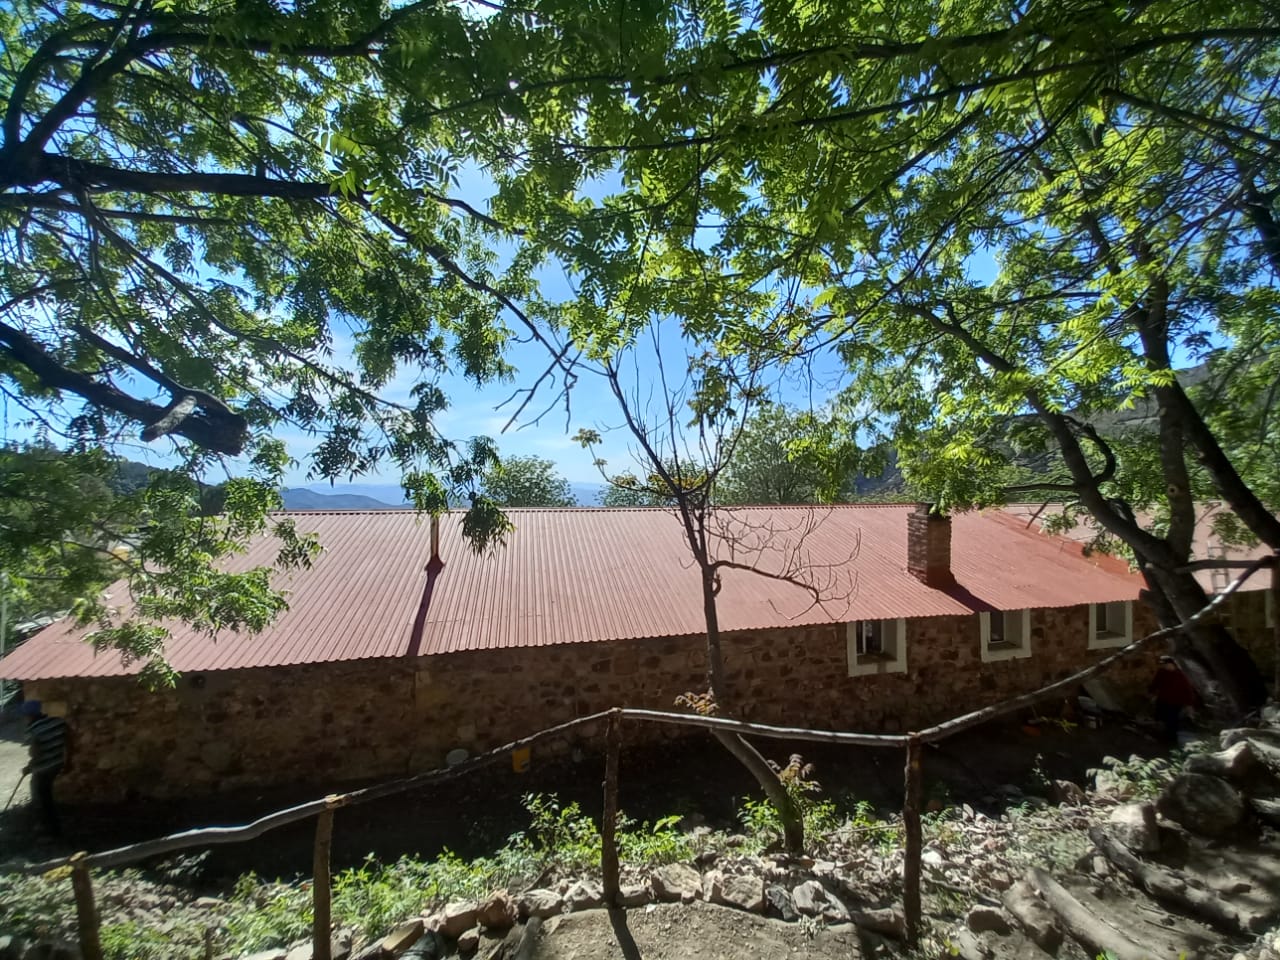
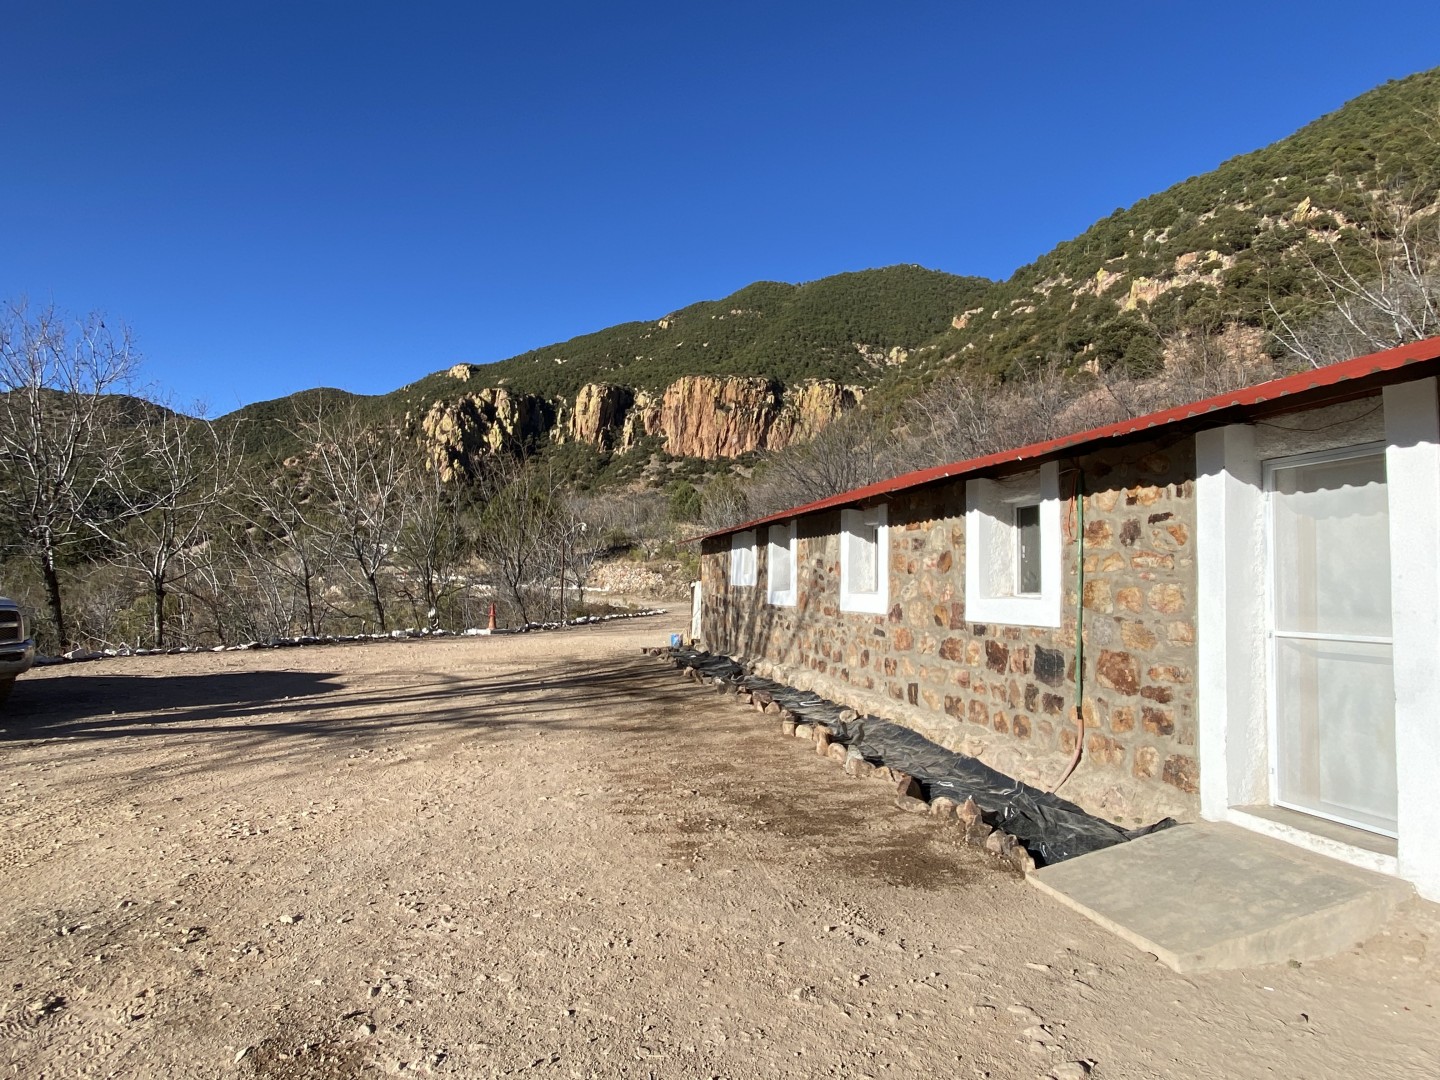
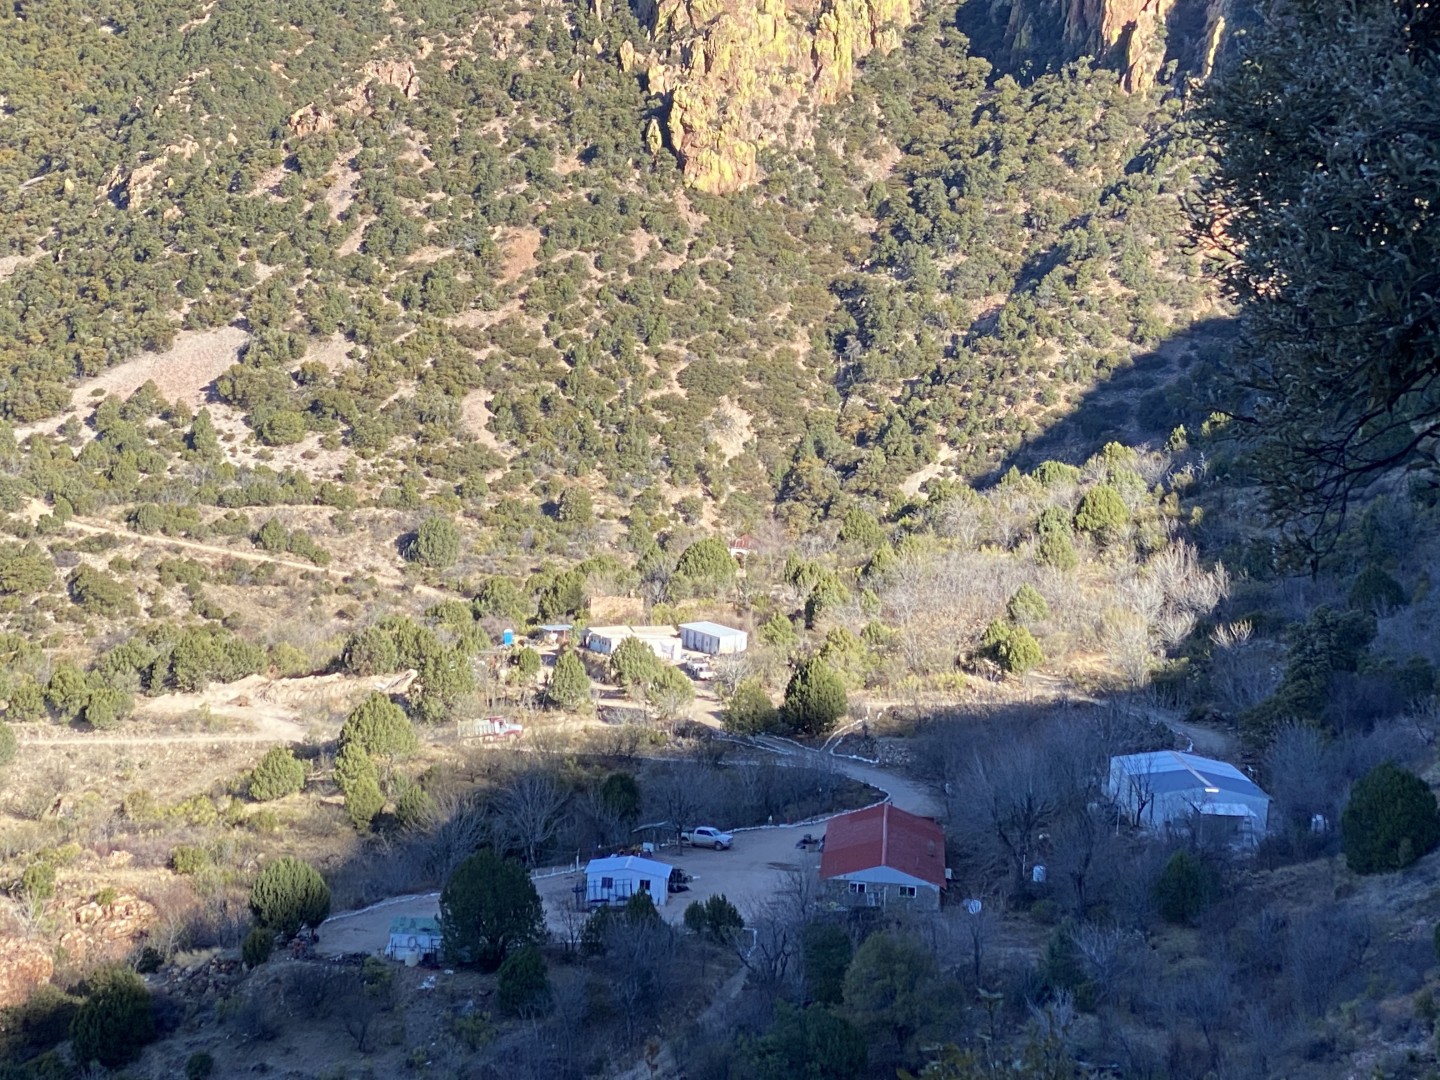
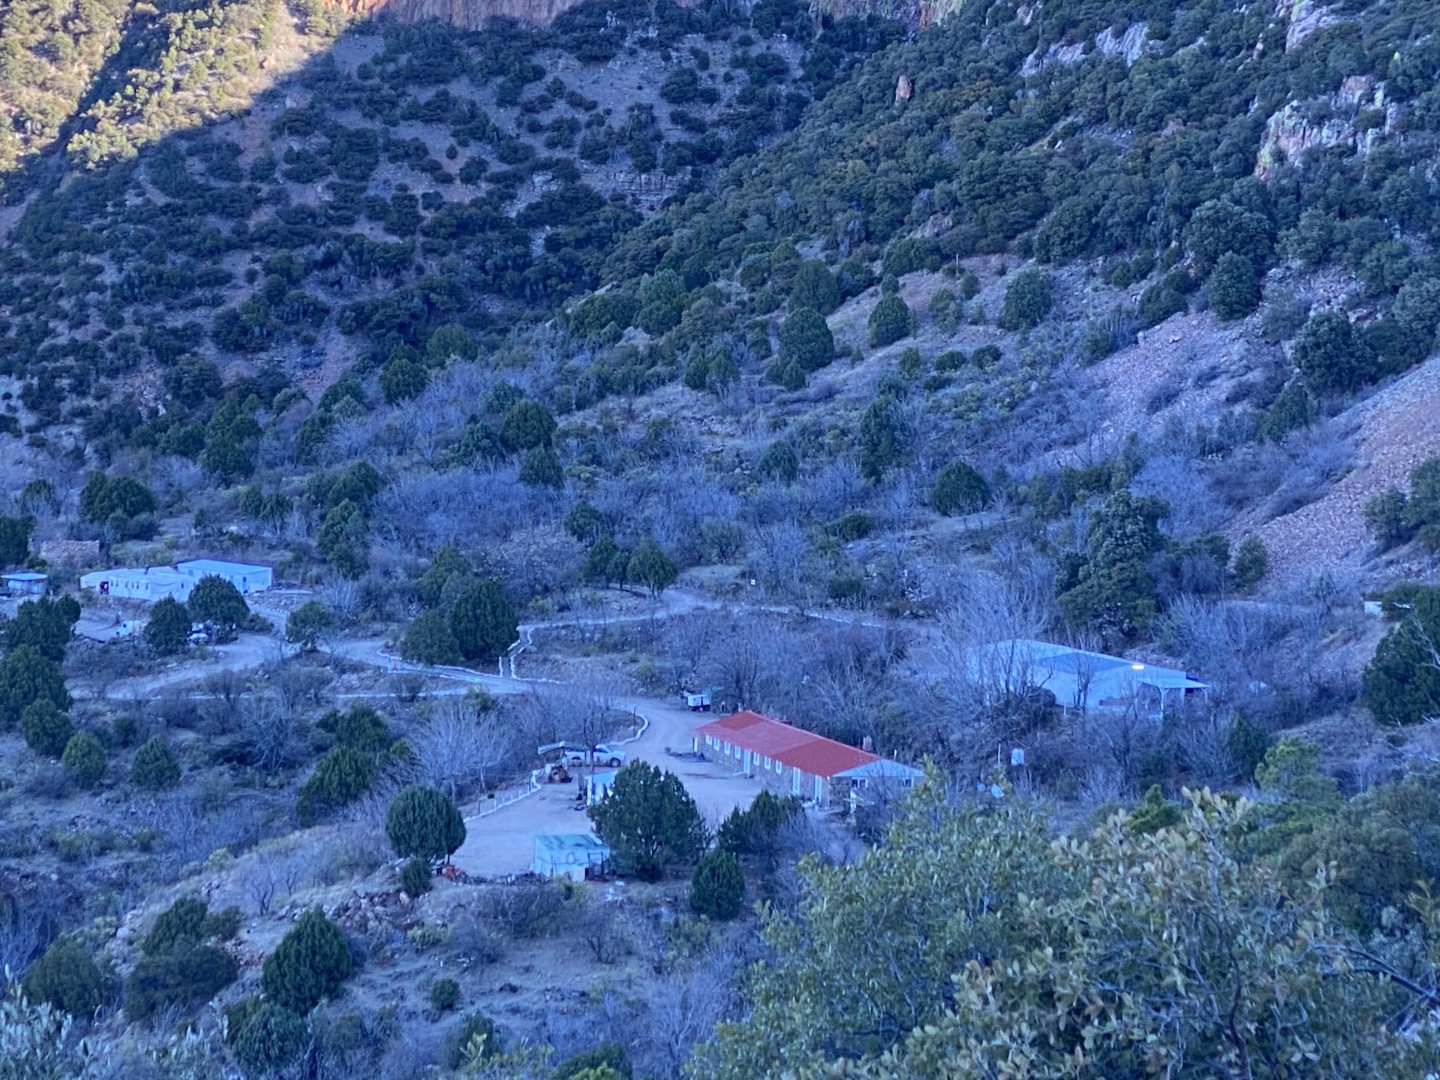
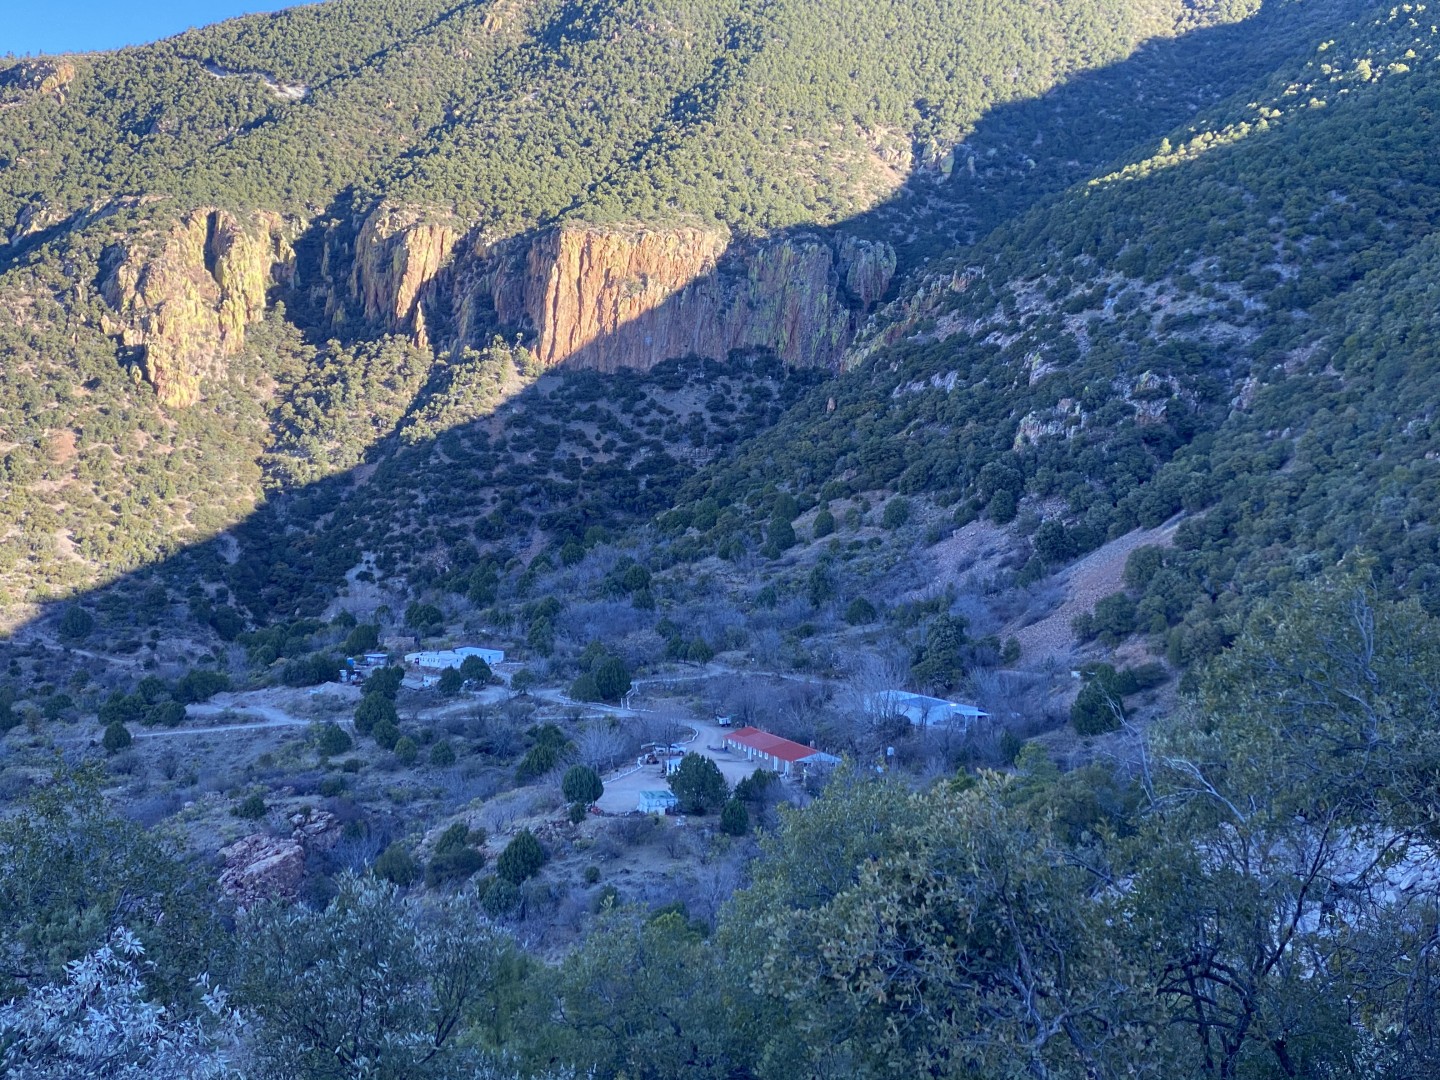
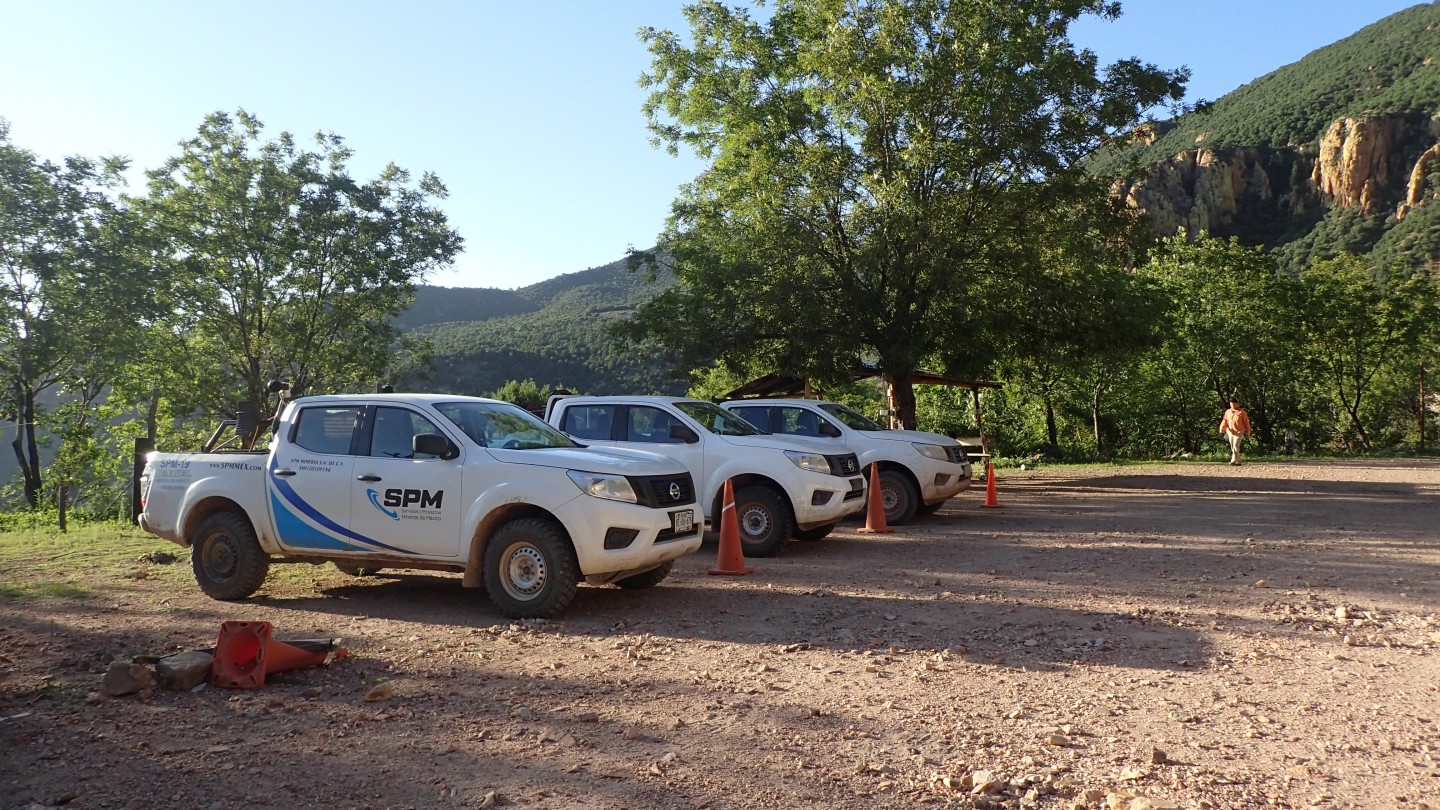
The Legendary Mining District "El Tigre"
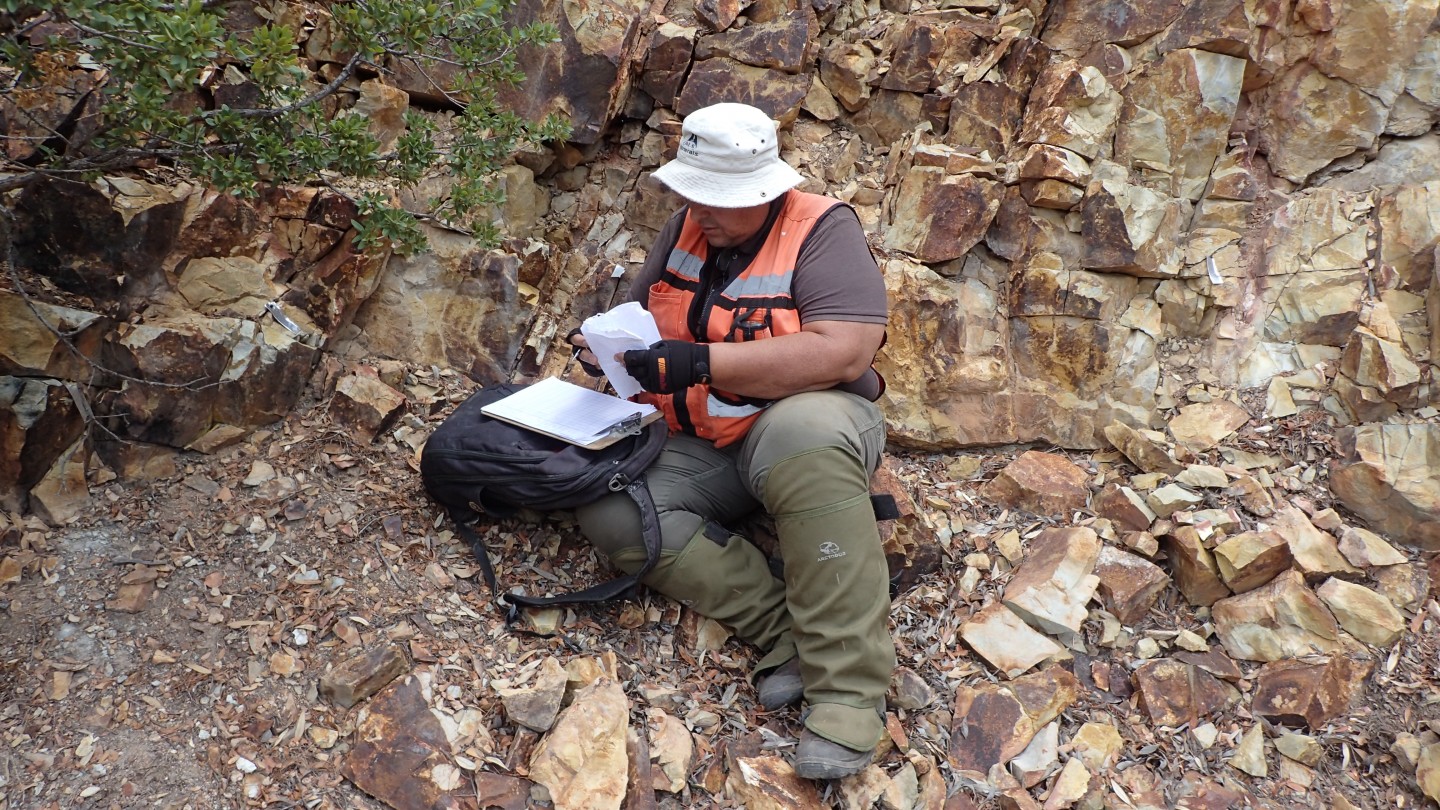
History, Production and Geology of the El Tigre District
Geology of El Tigre District - R.T. Mishler, 1920
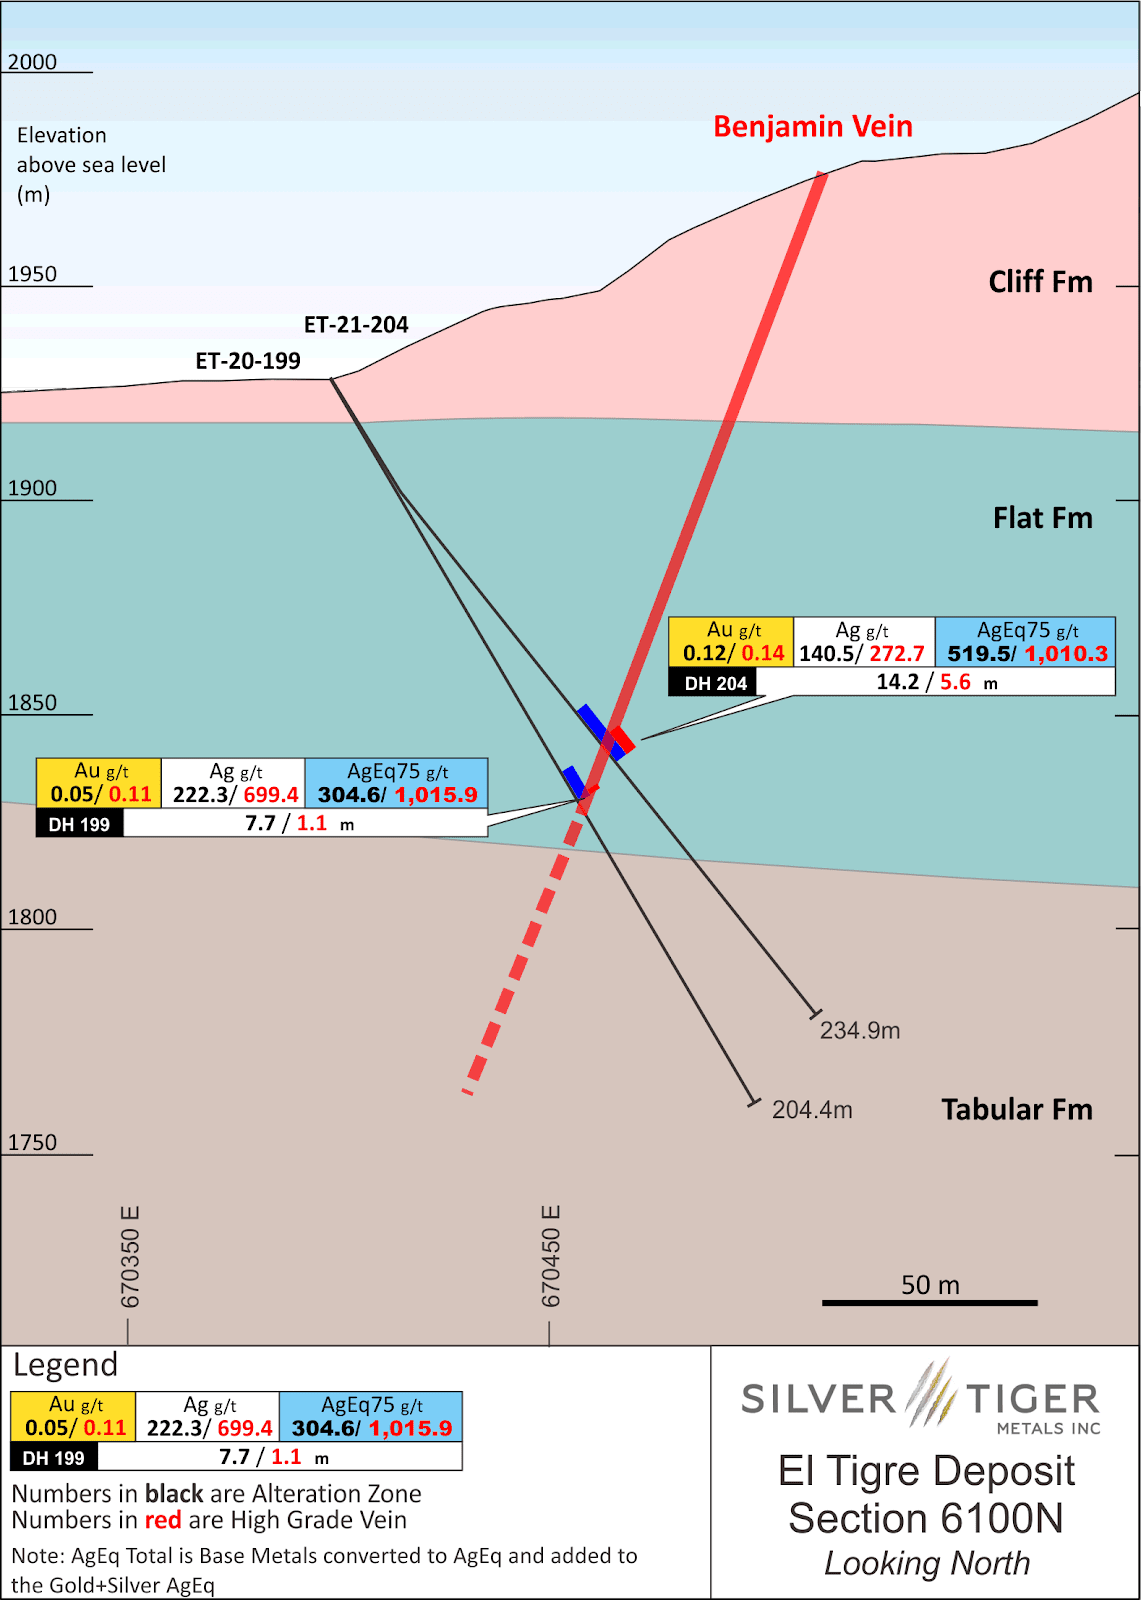
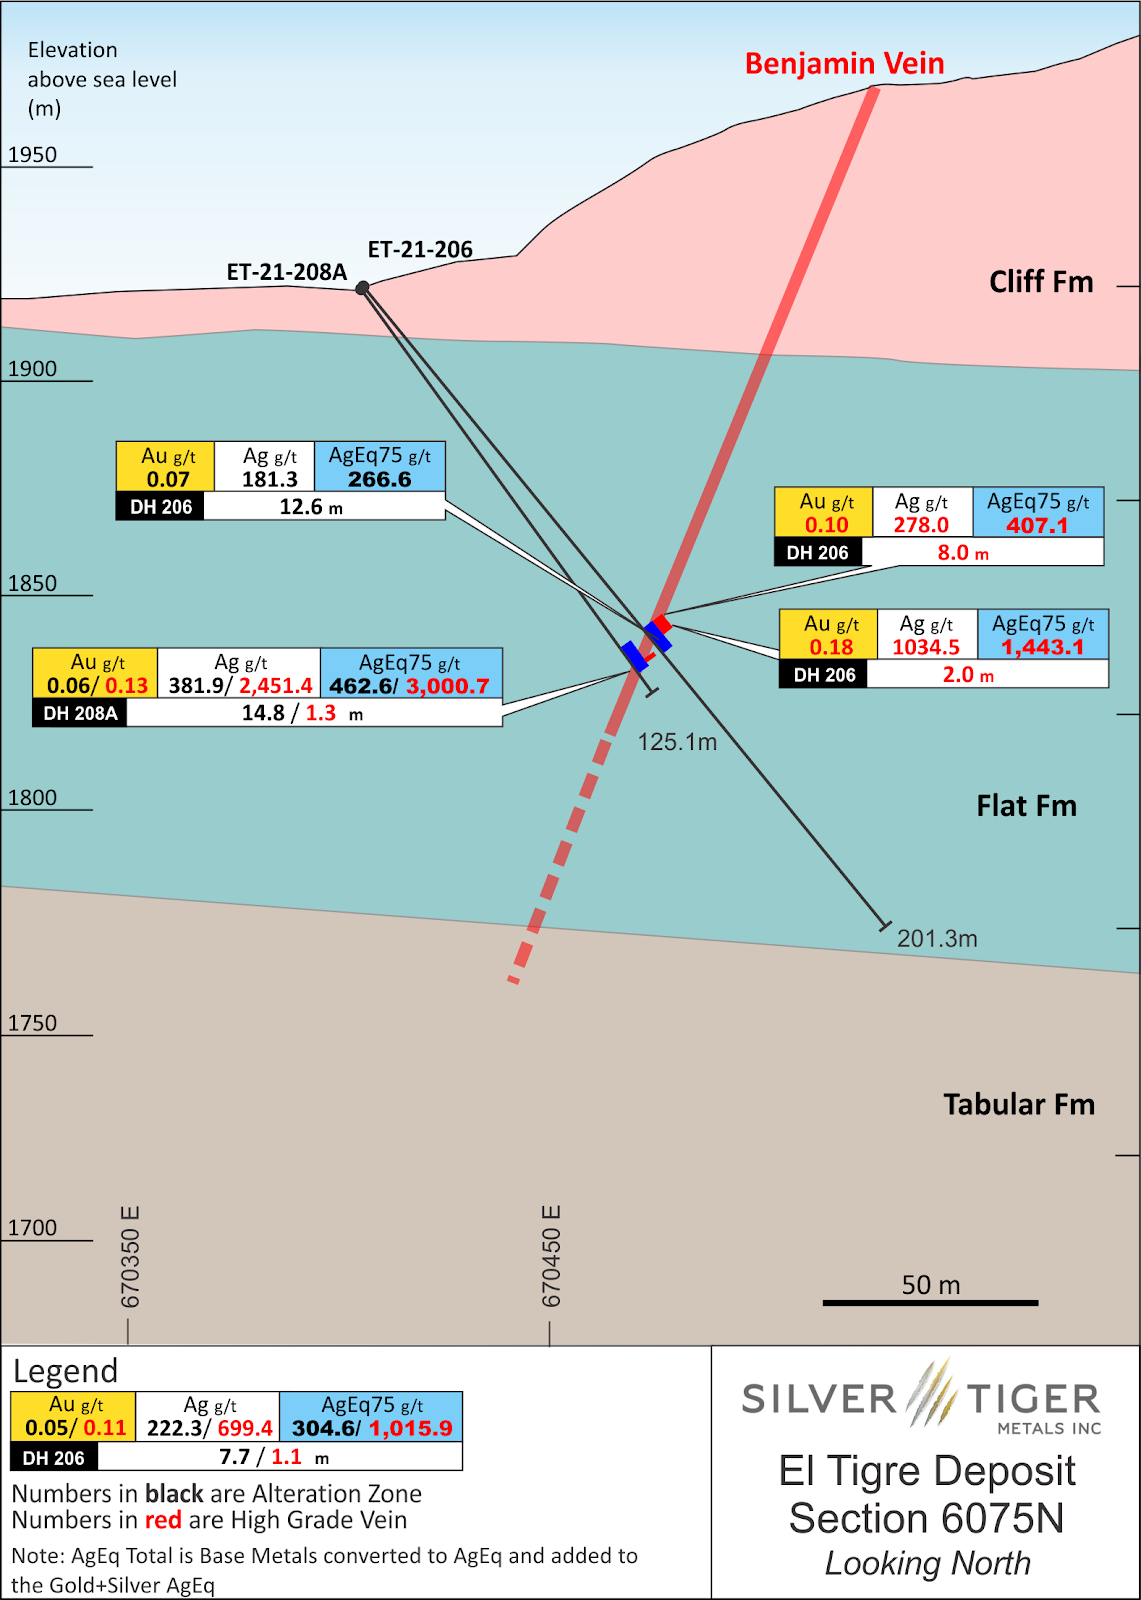
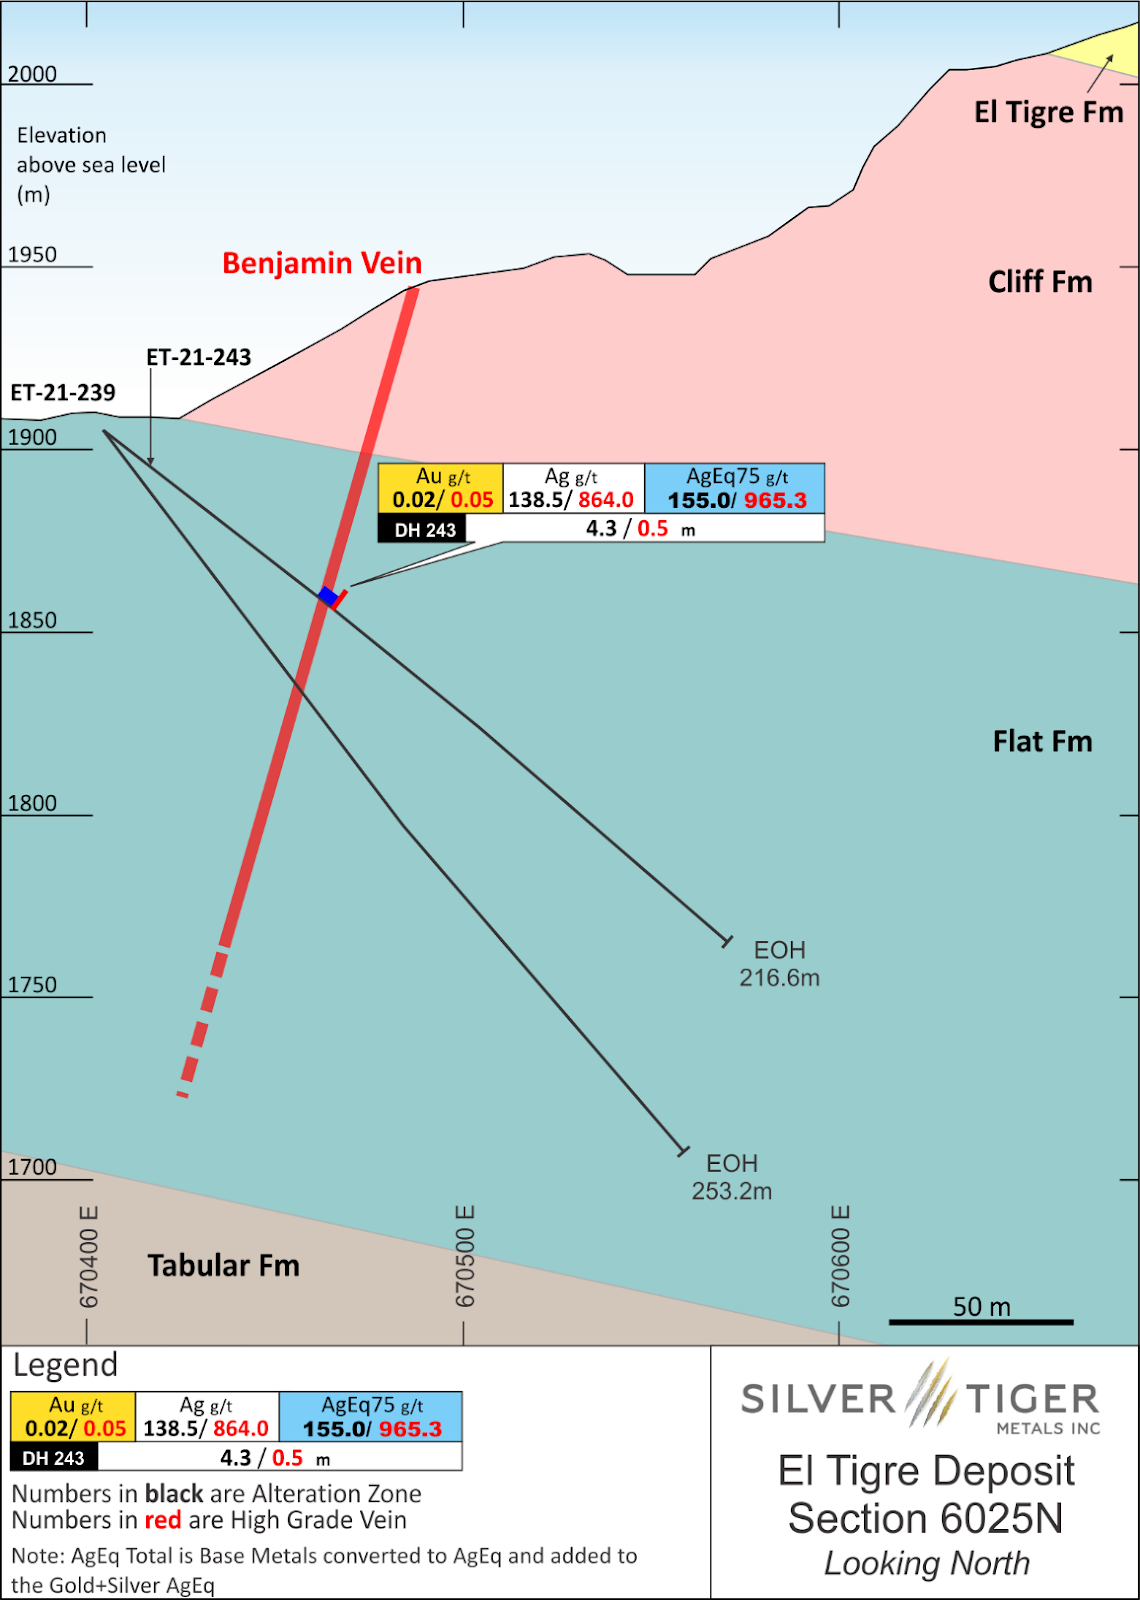
 El Tigre Cross Section 6100N - Benjamin Vein
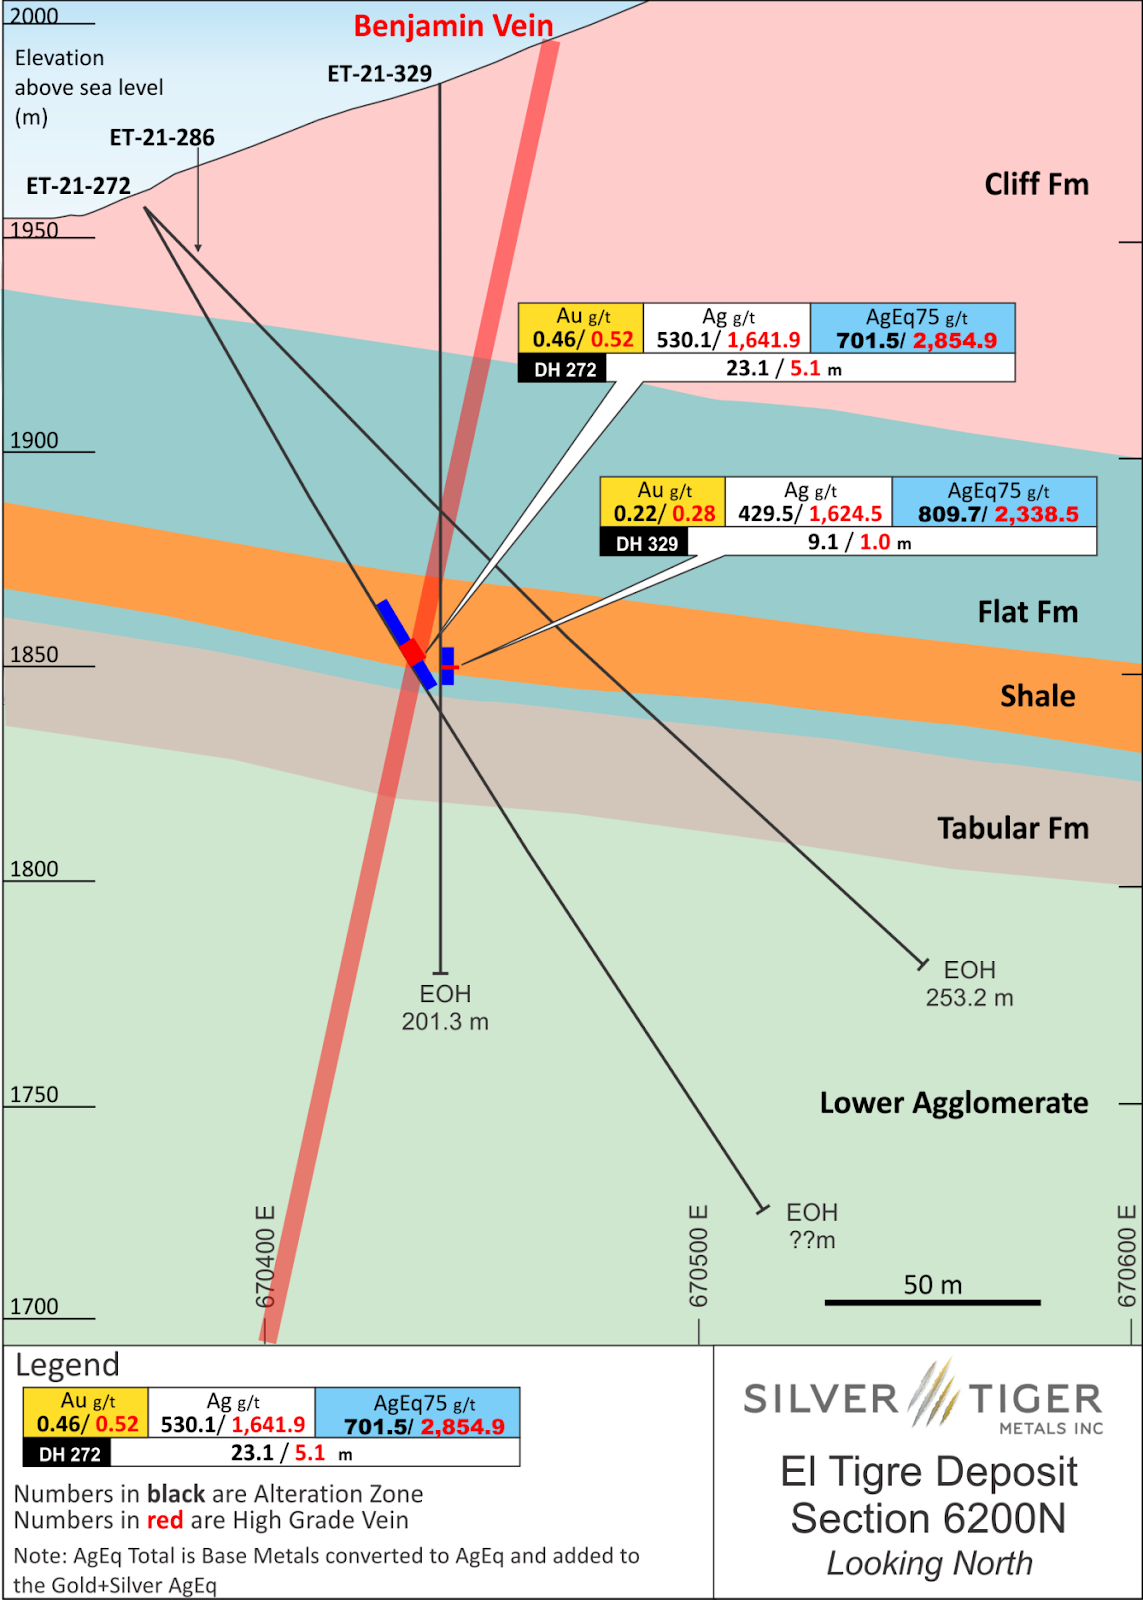


© 2024 Silver Tiger Metals Inc.|TSXV:SLVR, OTCQX:SLVTF|Disclaimer
User Agreement
The following terms and conditions, along with all other terms and legal notices located on this https://silvertigermetals.com website (collectively, "Terms"), govern your use of this https://silvertigermetals.com website (the "Website"). If you do not understand and agree to be bound by all Terms, do not use this Website. Your use of this Website at any time constitutes a binding agreement by you to abide by these Terms.
Certain material found on this Website is protected by copyright. Certain names, graphics, logos, icons, designs, words, titles or phrases on this Website may constitute trade names, trademarks or service marks of Silver Tiger Metals Inc. ("Silver Tiger") or other entities. Trademarks may be registered in Canada and in other countries, as applicable. The display of trademarks on pages at this Website does not imply that a licence of any kind has been granted.
Although care has been taken in preparing and maintaining the information and materials contained on this Website, they are provided on an "as is" basis, without warranty of any kind, either express or implied, with respect to the accuracy or completeness of the information and Silver Tiger does not assume any responsibility or liability whatsoever for publishing them herein. In using this Website, you agree that Silver Tiger shall not be liable for any damages whatsoever (including indirect, incidental, special, punitive or consequential damages and loss of profits, opportunities or information) arising from (a) your use of or reliance on information contained on this Website; (b) any inaccuracy or omission in such information or failure to keep the information current; (c) use of any third-party web sites linked or referred to in this Website; (d) any delays, inaccuracies or errors in, or in the transmission of, any stock price quotes or historical price data; (e) any Internet software used in connection with this Website or computer viruses or other destructive programs encountered as a result of using this Website; and (f) any other matter connected with the Website, even if Silver Tiger is made aware of the possibility of such claims, damages or losses.
This Website contains links to, or feeds from, sites that Silver Tiger does not maintain. Silver Tiger assumes no responsibility for the contents of third-party sites accessed through links on, or otherwise incorporate in, this Website. Access to or information from such third-party sites is provided for your convenience only. Silver Tiger does not monitor or endorse such third-party sites.
This Website is not to be construed as a form of promotion, an offer to sell securities or as a solicitation to purchase our securities. This Website has been produced as a source of general information only.
Please note that this Website contains "forward-looking information", within the meaning of applicable Canadian securities legislation. Forward-looking information includes, but is not limited to, information with respect to our plans respecting our mineral projects and our other key mineral properties and the ability to secure and maintain required permits for such projects and properties, exploration expenditures and activities and the possible success of such exploration activities, the estimation of mineral reserves and resources, the realization of mineral estimates, the timing and amount of estimated future production, costs of production, capital expenditures, costs and timing of the development of new deposits, mineral pricing, mine life projections, the availability of third-party concentrate, business and acquisition strategies and the timing and possible outcome of pending litigation. Often, but not always, forward-looking information can be identified by the use of words like "plans", "expects", "estimates", "forecasts", "intends", "understands", "anticipates", and similar expressions. Forward-looking information is based on the opinions and estimates of management as of the date such information is provided and is subject to known and unknown risks, uncertainties and other factors that may cause our actual results, level of activity, performance or achievements to be materially different from those expressed or implied by such forward-looking information, including risks associated with the mining industry such as economic factors (including future commodity prices, currency fluctuations and energy prices), failure of plant, equipment, processes and transportation services to operate as anticipated, dependence on key personnel and employee relations, environmental risks, government regulation, actual results of current exploration activities, possible variations in ore grade or recovery rates, permitting timelines, capital expenditures, reclamation activities, land titles, and social and political developments and other risks of the mining industry. Although we have attempted to identify important factors that could cause actual results to differ materially from those contained in forward-looking information, there may be other factors that cause results not to be as anticipated, estimated or intended. There can be no assurance that forward-looking information will prove to be accurate, as actual results and future events could differ materially from those anticipated in such information. Accordingly, readers should not place undue reliance on forward-looking information. We do not undertake to update any forward-looking information, except as required by applicable securities laws, or to comment on analyses, expectations or statements made by third parties in respect of us, our financial or operating results or our securities.
The disclosure on this Website has been prepared in accordance with the requirements of Canadian securities laws, which differ from the requirements of United States securities laws. Disclosure, including scientific or technical information, has been made in accordance with Canadian National Instrument 43-101 -- Standards of Disclosure for Mineral Projects ("NI 43-101"). NI 43-101 is a rule developed by the Canadian Securities Administrators that establishes standards for all public disclosure an issuer makes of scientific and technical information concerning mineral projects. As a result, information contained on this Website containing descriptions of the mineral properties or estimates of mineral reserves or resources of Silver Tiger is not comparable to similar information disclosed by U.S. companies in reports filed with the SEC.
For example, the terms "measured mineral resources", "indicated mineral resources", "inferred mineral resources", "proven mineral reserves" and "probable mineral reserves" are used on this Website to comply with the reporting standards in Canada. While those terms are recognized and required by Canadian regulations, the SEC does not recognize them.
Under the rules and regulations of the SEC set forth in Industry Guide 7, a U.S. company may only disclose estimates of proven and probable mineral reserves, and may not disclose estimates of any classification of mineral resources. In addition, the definitions of proven and probable mineral reserves used in NI 43-101 differ from the definitions in the SEC Industry Guide 7. Under United States standards, mineralization may not be classified as a "reserve" unless the determination has been made that the mineralization could be economically and legally produced or extracted at the time the reserve determination is made. Investors are cautioned not to assume that all or any part of the mineral deposits in these categories will ever be converted into mineral reserves. Any estimate of mineral reserves or resources has a great amount of uncertainty as to its existence, and great uncertainty as to its economic and legal feasibility with estimates of mineral resources having a greater degree of uncertainty. It cannot be assumed that all or any part of measured mineral resources, indicated mineral resources or inferred mineral resources will ever be upgraded to a mineral reserve or mined. Further, in accordance with Canadian rules, estimates of inferred mineral resources cannot form the basis of feasibility or other economic studies. Investors are cautioned not to assume that any part of the reported measured mineral resources, indicated mineral resources, or inferred mineral resources on this Website will ever be classified as a reserve. Disclosure of "contained ounces" is permitted disclosure under Canadian regulations; however, the SEC normally only permits issuers to report mineralization that does not constitute reserves as in place tonnage and grade without reference to unit measures.